
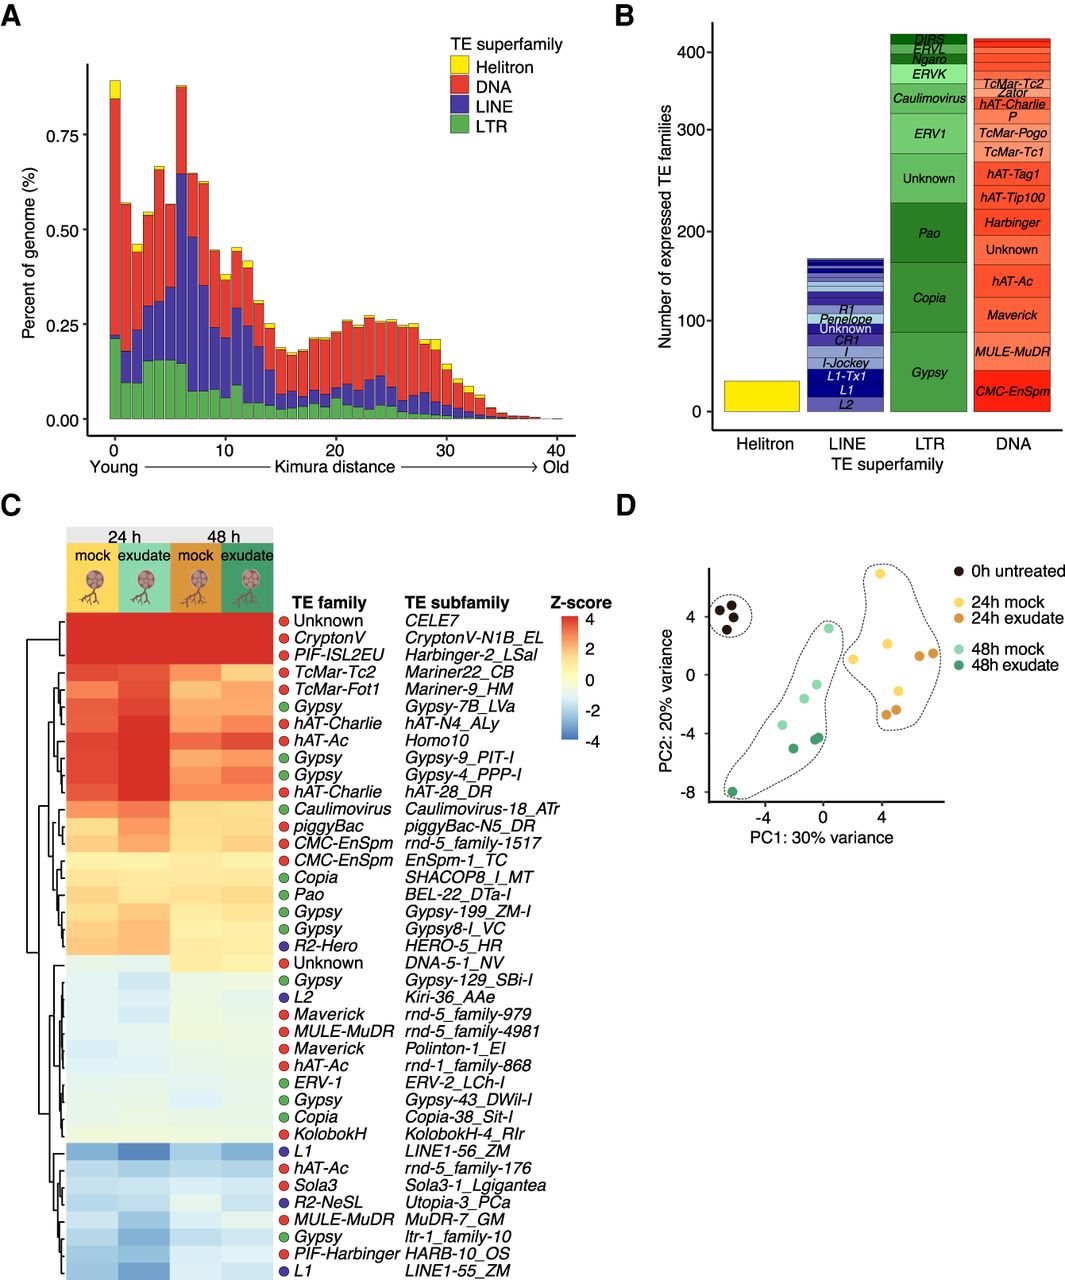
Transposon expression during R. irregularis spore development. (A) Repeat landscapes showing Kimura distance-based copy divergence analysis of TEs in R. irregularis genome shown as genome coverage (%) for each TE superfamily plotted against Kimura distance. Clustering was performed according to their Kimura distances of TEs (CpG adjusted K-value from 0 to 50). TE copies with a low Kimura distance value have a low divergence from the consensus sequence and may correspond to recent replication events. Sequences with a higher Kimura distance value corresponded to older divergence. Note that we omitted unclassified elements. (For repeat landscape including unclassified elements, see Supplemental Fig. S1.) (B) Number of expressed transposon subfamilies, grouped superfamilies. (C) Heat map and hierarchical clustering of differentially expressed TE subfamilies (|log2FC| > 0.5; FDR < 0.05) in the spore developmental assay. Five conditions were used in total, a 0-h control treatment, 24-h mock and rice exudate treatments, and 48-h mock and rice exudate treatments (four replicates per treatment). Expression of 24-h and 48-h conditions were normalized against expression in the control, 0-h condition. (D) Principal component analysis of TE subfamily expression across all replicates and conditions.


