
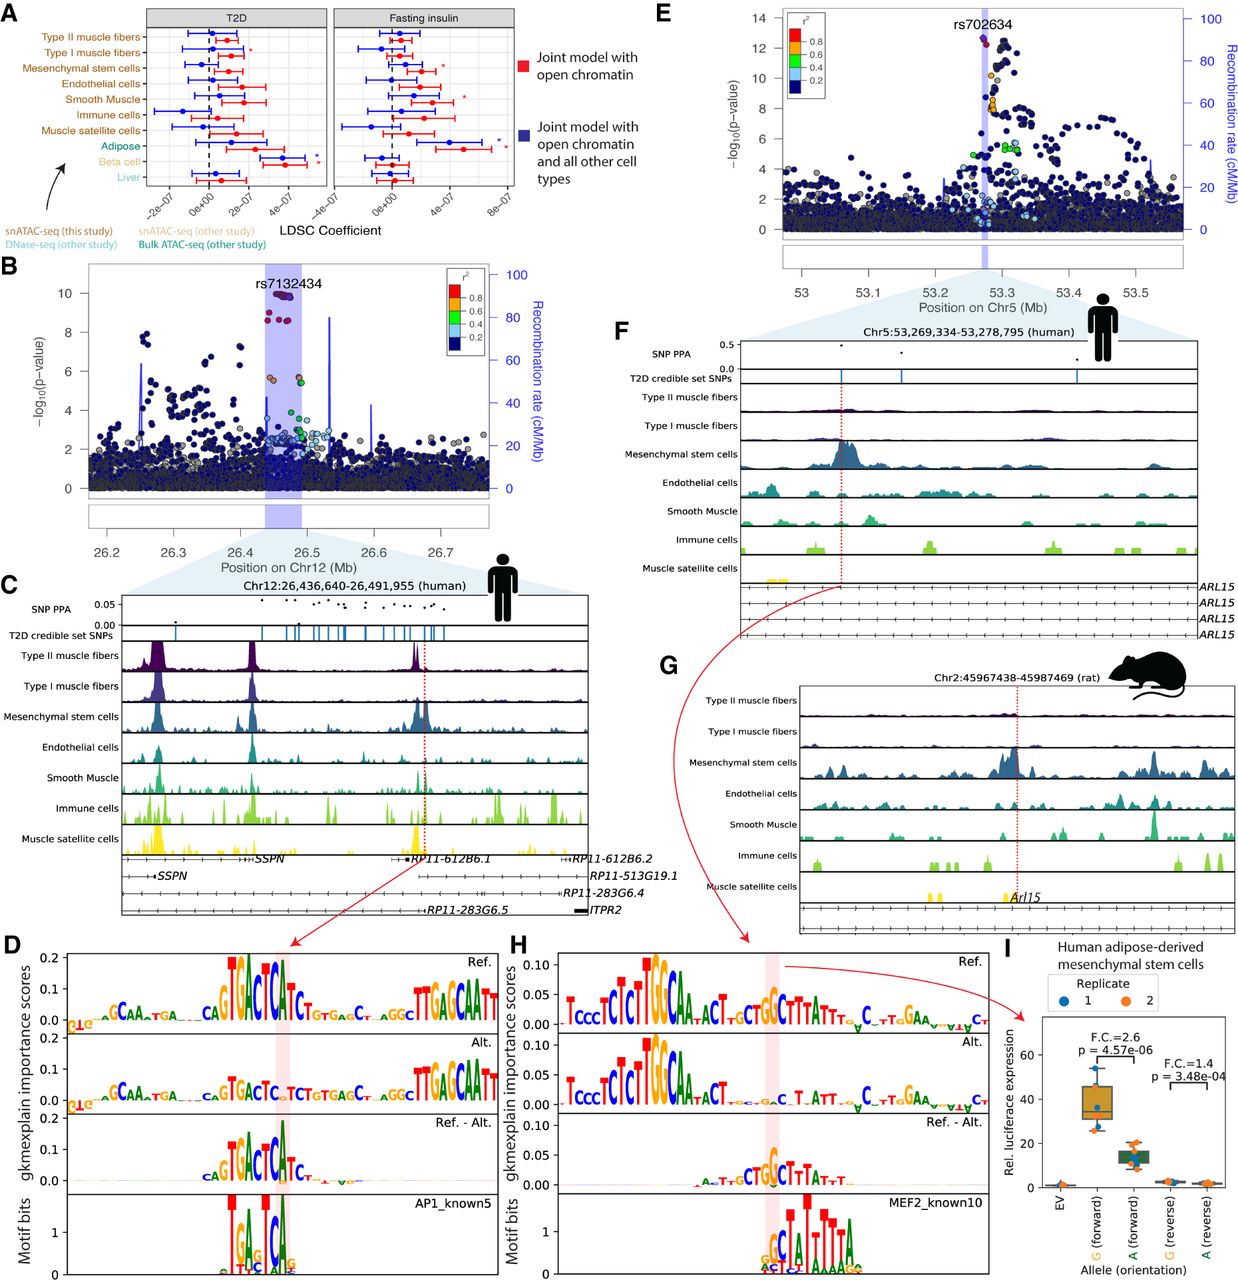
Integration of cell type–specific ATAC-seq peaks with T2D GWAS nominates causal cell types, regulatory elements, and SNPs. (A) LDSC-partitioned heritability results for T2D (BMI-unadjusted) and fasting insulin GWAS (BMI-adjusted), using human peak calls. For each cell type, one model was run adjusting for cell type–agnostic annotations from the LDSC baseline model and common open chromatin regions. Asterisks represent Bonferroni significance (P < 0.05 after adjusting for 40 tests). (B) LocusZoom plot for ITPR2 (T2D). (C) T2D credible set near the ITPR2 gene, consisting of 22 SNPs. Only SNP rs7132434 (highlighted in red) overlaps a peak call in any of the muscle cell types. (D) gkmexplain importance scores for the ref and alt allele (top two rows) and the difference between the ref and alt importance scores (third row); the G allele disrupts an AP-1 motif (bottom row). (E) LocusZoom plot for ARL15 locus (T2D). (F) T2D credible set SNPs near the ARL15 gene. The three SNPs represent the three-SNP credible set discussed in the text. One of these SNPs (rs702634; highlighted in red) overlaps a mesenchymal stem cell–specific peak. (G) Projecting the SNP highlighted in F, rs702634, into the rat genome (projected SNP position indicated by the red vertical line) shows the corresponding region has open chromatin in rat mesenchymal stem cells. (H) gkmexplain importance scores for the ref and alt alleles (top two rows), the difference between them (third row), and a MEF2 motif disrupted by the SNP. (I) Luciferase assay using a construct containing either allele of SNP rs702634 in human adipose-derived mesenchymal stem cells. Each point represents one clone; the experiment was performed twice, once on two different days (“Replicate”). P-values computed using a two-sided unpaired t-test. Copyright disclosure for rat cartoon: Rat by Francisca Arévalo from the Noun Project (https://thenounproject.com/search/?q=rat&i=15130).


