
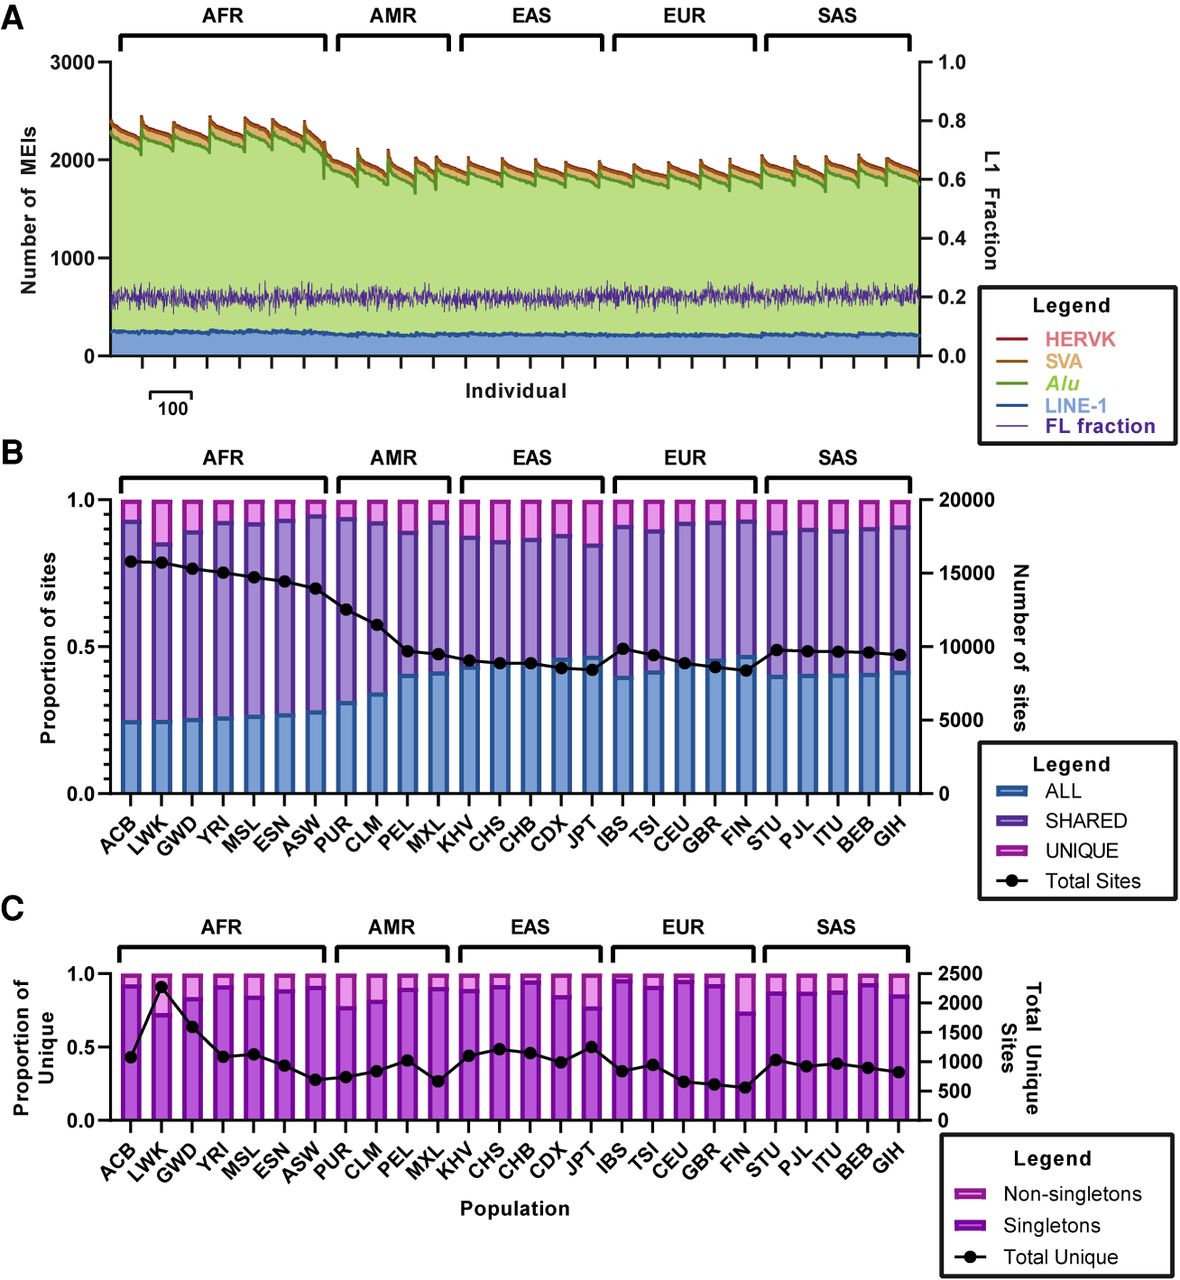
MEI counts per individual and population sharing across the 26 diverse 1KGP populations. (A) The numbers of MEIs per individual are depicted for the 26 diverse 1KGP populations: (light blue) LINE1; (light green) Alu; (light brown) SVA; (red) HERV-K. Dark lines of the same colors represent the boundaries between element classes. The dark purple line indicates the number of non-REF FL-L1Hs elements per individual. Note that the AFR populations have the highest MEI counts, consistent with previous studies (Sudmant et al. 2015). (B) Sharing of MEIs across the 26 diverse populations of the 1KGP. (C) MEIs that are unique to one of the 26 1KGP populations are broken down into singleton and non-singleton categories. We also performed similar analysis comparing the Amish, Jackson Heart Study, and the UKBB populations (Supplemental Fig. S6).


