
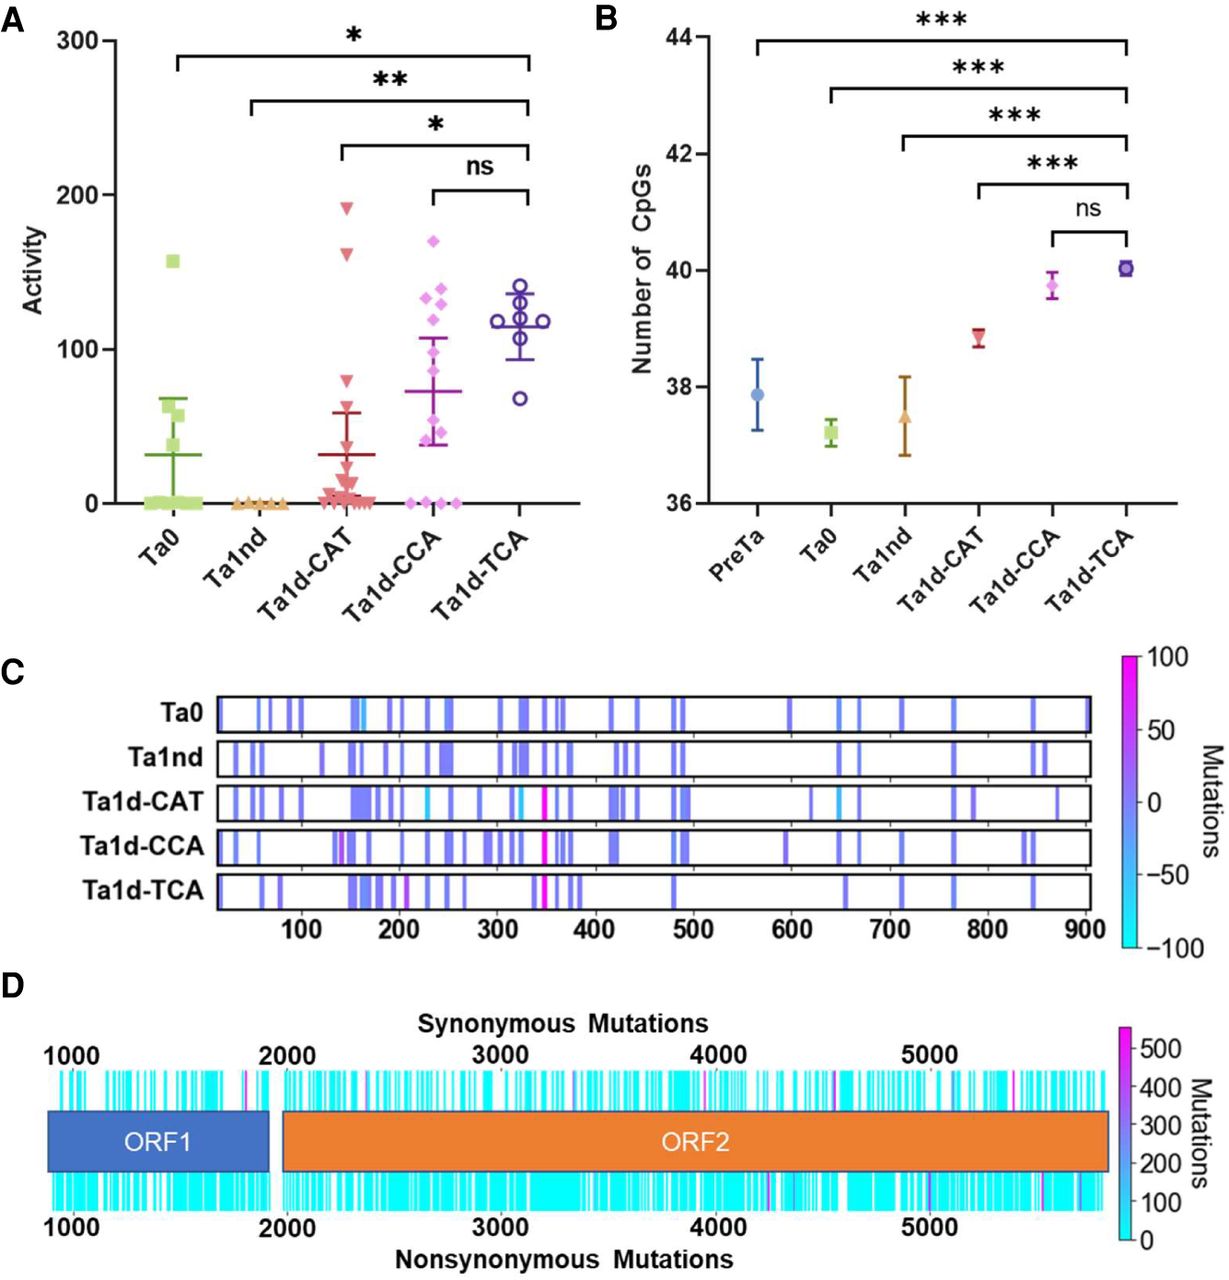
Analysis of new subfamilies, CpGs, and other interior sequence changes in our FL-L1Hs elements. (A) We identified elements from various L1 subfamilies (including our three novel subfamilies) that previously had been sequenced and tested in cell culture retrotransposition assays (Beck et al. 2010). Note that the new Ta1d-TCA subfamily has the highest levels of activity followed by the new Ta1d-CCA subfamily. The Ta1d-CAT and Ta0 subfamilies have similar activities. Significance was calculated by one-way ANOVA corrected for multiple comparisons by the Tukey method. Error bars represent 95% confidence intervals. (B) We also plotted the number of CpGs by subfamily in our sequenced FL-L1Hs elements and found that our three new subfamilies (Ta1d-CAT, Ta1d-CCA, and Ta1d-TCA) have 1–2 additional CpGs in their promoter regions compared to older subfamilies. (C) Mutations in the promoter region causing a gain or loss of CpGs for each L1 subfamily. The color shows the frequency of gain or loss as denoted by the diverging color map. (D) Mutations within the two ORFs. Note the synonymous and nonsynonymous mutations above and below the ORF map, respectively. The frequency of the mutations also is shown with the diverging color map.


