
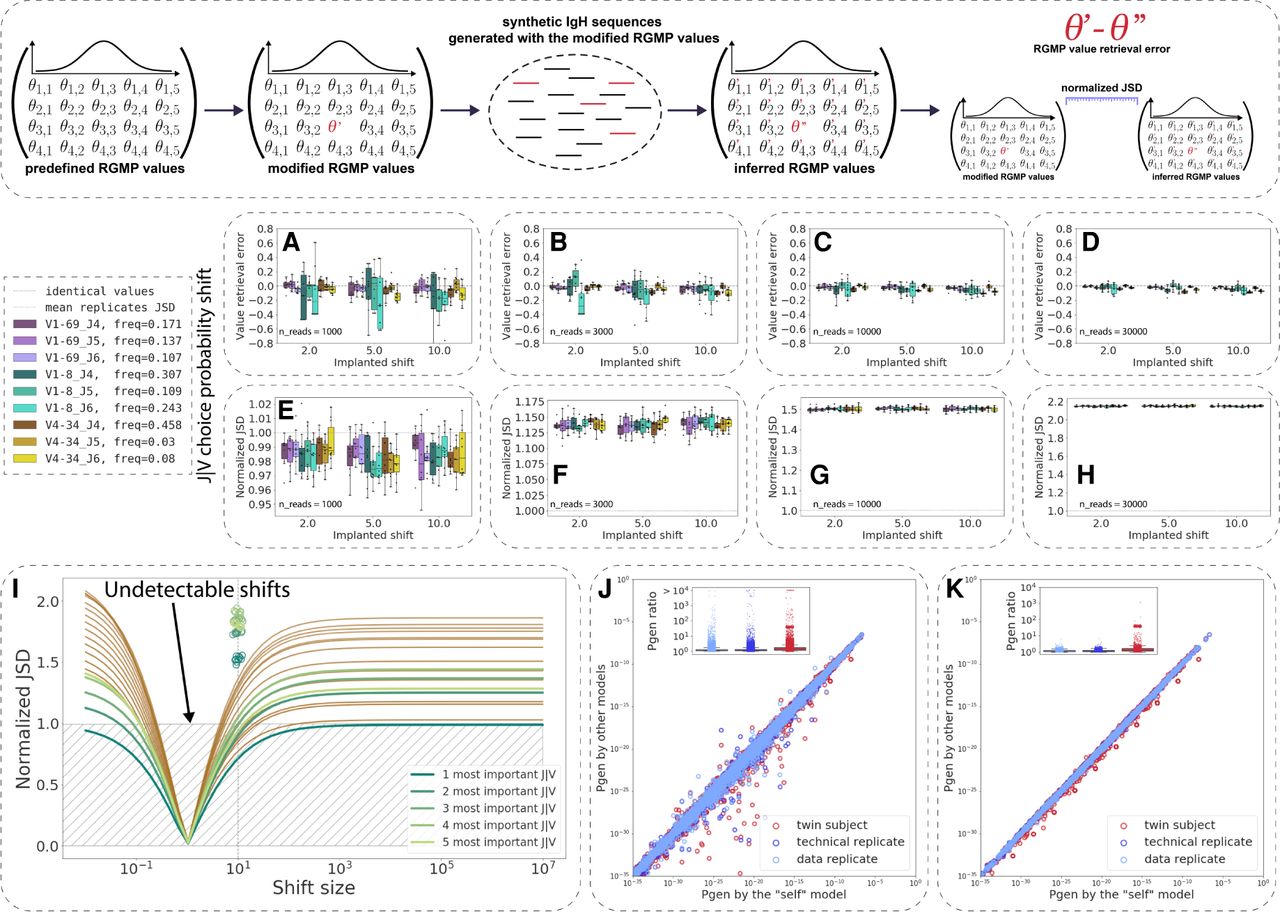
The sensitivity of RGMP inference and their impact on Pgen values vary by RGMP. (Inset) Given a set {Θ} of RGMPs, we modified one of the parameter values, obtaining a modified RGMP set {Θ′}, generated a set of synthetic IgH sequences using {Θ′} and then inferred RGMP values from these sequences, thus obtaining RGMP set {Θ′′}. By comparing {Θ′} and {Θ′′}, we estimated the stability of the RGMP inference model in IGoR. (A–D) RGMP value retrieval error (the difference between the inferred parameter value and the ground truth one) for RGMPs inferred from synthetic samples that were generated using a modified RGMP set with increased conditional probability to observe a certain J segment given a V segment for synthetic sample sizes of 1000, 3000, 10,000, and 30,000 sequencing reads (10 synthetic samples for each sample size) based on the HUMAN2 data set. The dashed line corresponds to zero difference (i.e., no error observed). (E–H) Normalized JSD between the inferred RGMP sets and the initial modified one (boxes; each box corresponds to the same 10 synthetic samples that were used in A–D). Average normalized JSD across the inferred RGMP sets themselves equals one because it is the value used for normalization (i.e., between synthetic replicates; dotted line). (I) All J|V conditional probabilities are ranked by their importance, then the k (k in [1…20]) most important probabilities are chosen and multiplied by a coefficient from 10−2 to 106; the rest is rescaled, to sum up to one. The x-axis corresponds to this multiplicative coefficient. The y-axis corresponds to the normalized JSD between the modified model and the unmodified one. The green colors correspond to the first five most important parameters. The circles correspond to the values obtained by generating synthetic samples using the modified model and inferring the parameters back as in E–H. (J) Pgens evaluated on identical sequences using different RGM parameter values (each point corresponds to a single sequence). The x-axis corresponds to the Pgen evaluated using the model parameter values inferred from the same sequences that the Pgens were computed for (the “self” model). The y-axis corresponds to the Pgens evaluated using other RGMP values (inferred from a data replicate sample, a technical replicate sample, and a sample from a twin subject). The boxplots show the corresponding Pgen ratio distributions. (K) Analogous to J but the Pgens were computed only on a set of sequences that consisted of the most impactful combinations of V and J segments (five top pairs as computed in I).


