
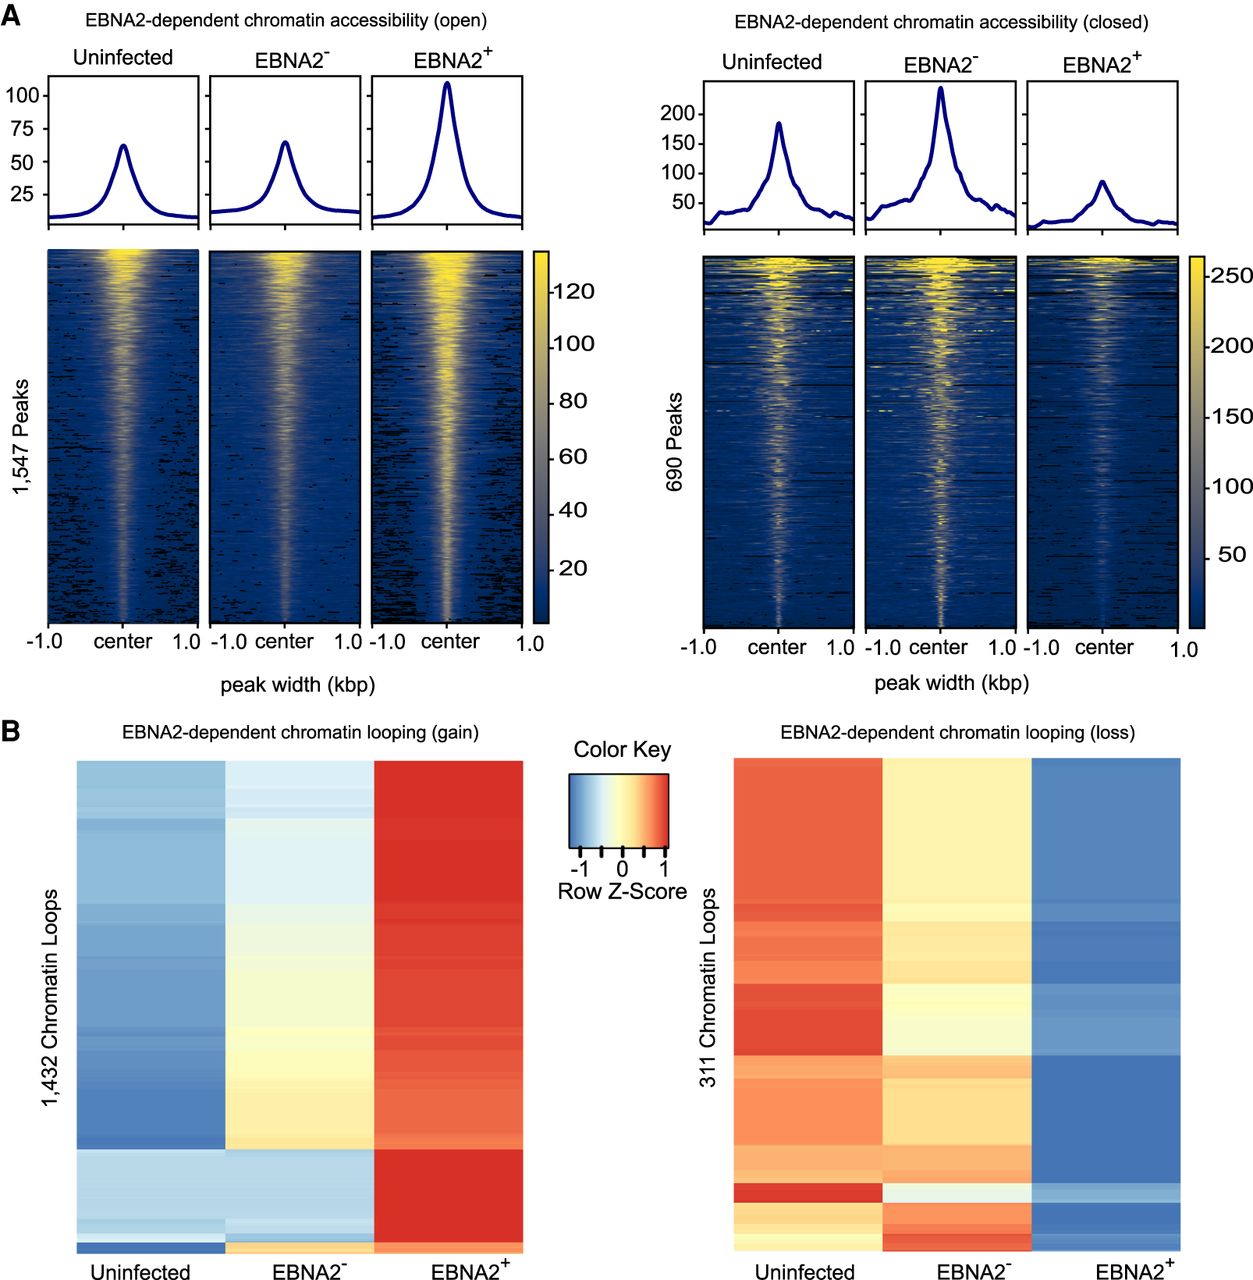
Figure 3.
EBNA2-dependent chromatin accessibility and chromatin looping. (A) EBNA2-dependent open chromatin regions and EBNA2-dependent closed chromatin regions are depicted on the left and right, respectively. Values in the heatmaps indicate normalized read counts per genomic region and were generated using the computeMatrix tool in the deepTools package (Ramírez et al. 2016). (B) EBNA2-dependent chromatin loop gains (left) and losses (right). Values in the heatmaps indicate the normalized relative Z-score of the FPKMs across each row (i.e., the default normalization method in the R “heatmap” function) (R Core Team 2021).


