
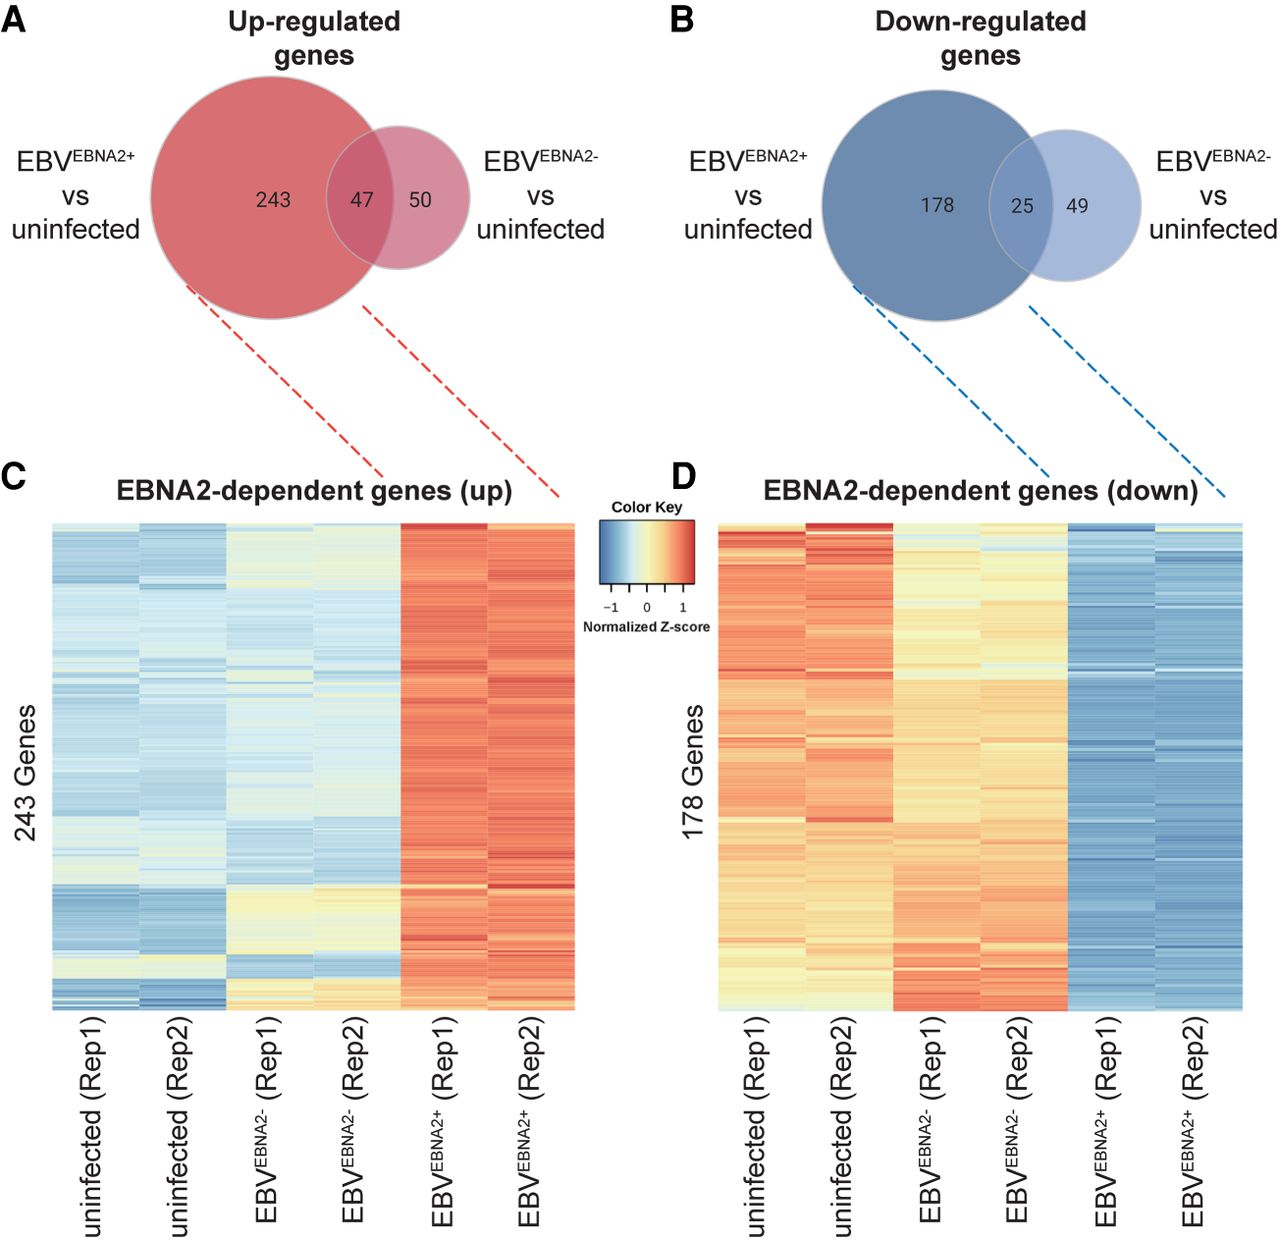
Figure 2.
Differential gene expression in EBV-infected Ramos cells. Venn diagrams depicting the number of up-regulated genes (A) and down-regulated genes (B) based on comparisons between EBVEBNA2+ versus uninfected and EBVEBNA2− versus uninfected conditions, respectively. Heatmaps depict genes that are specifically expressed higher (C) or lower (D) in EBVEBNA2+ cells. Values in the heatmaps indicate the normalized relative Z-score of the FPKMs across each row (i.e., the default normalization method in the R “heatmap” function) (R Core Team 2021).


