
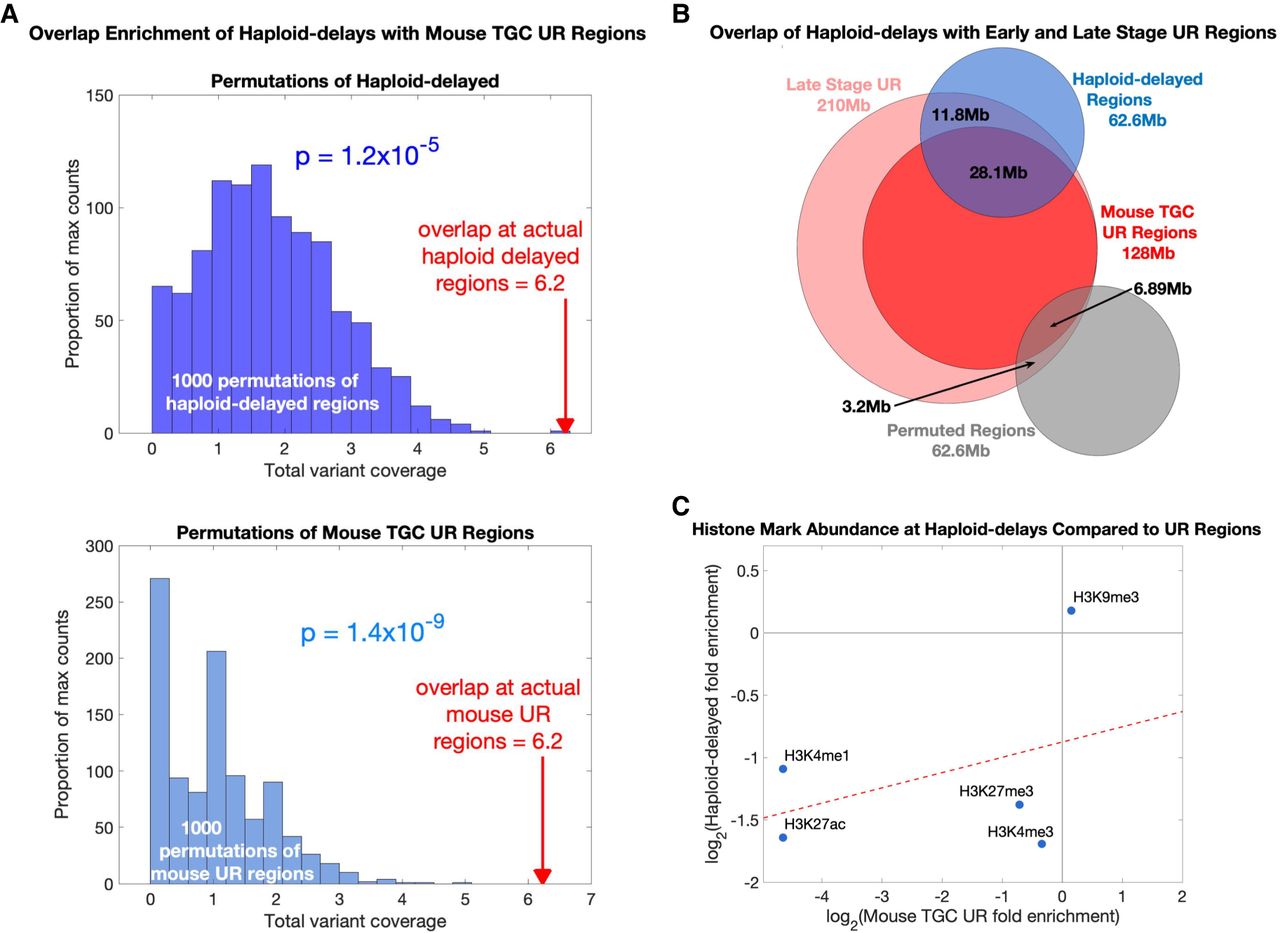
Regions of replication delay in haploid cells corresponds to underreplication in polypoid cells. (A) Haploid-delayed variants significantly overlap UR regions in mouse TGCs compared to matched permutations. Top histogram (dark blue): degree of overlap between mouse UR regions and 1000 permutations of haploid-delayed variants; bottom histogram (light blue): degree of overlap between haploid-delayed regions and 1000 permutations of UR regions. Red arrows: overlaps between actual haploid-delayed variants and actual mouse UR regions. Each overlap was counted as the fraction of the haploid-delayed variant that overlapped a UR region (i.e., a value between 0 and 1 for each variant, with a maximum overlap value of 21 corresponding to the 21 haploid-delayed variants). (B) Venn diagram comparing haploid-delayed variants (blue) to mouse UR regions (red). Dark red: shared regions found in all mouse placenta; light red: regions only identified at later stages of development. Gray: randomly selected permutation; that is, one of the 1000 permutations in the top histogram of A. (C) Histone mark enrichments at haploid-delays resemble those in mouse TGCs at UR regions.


