
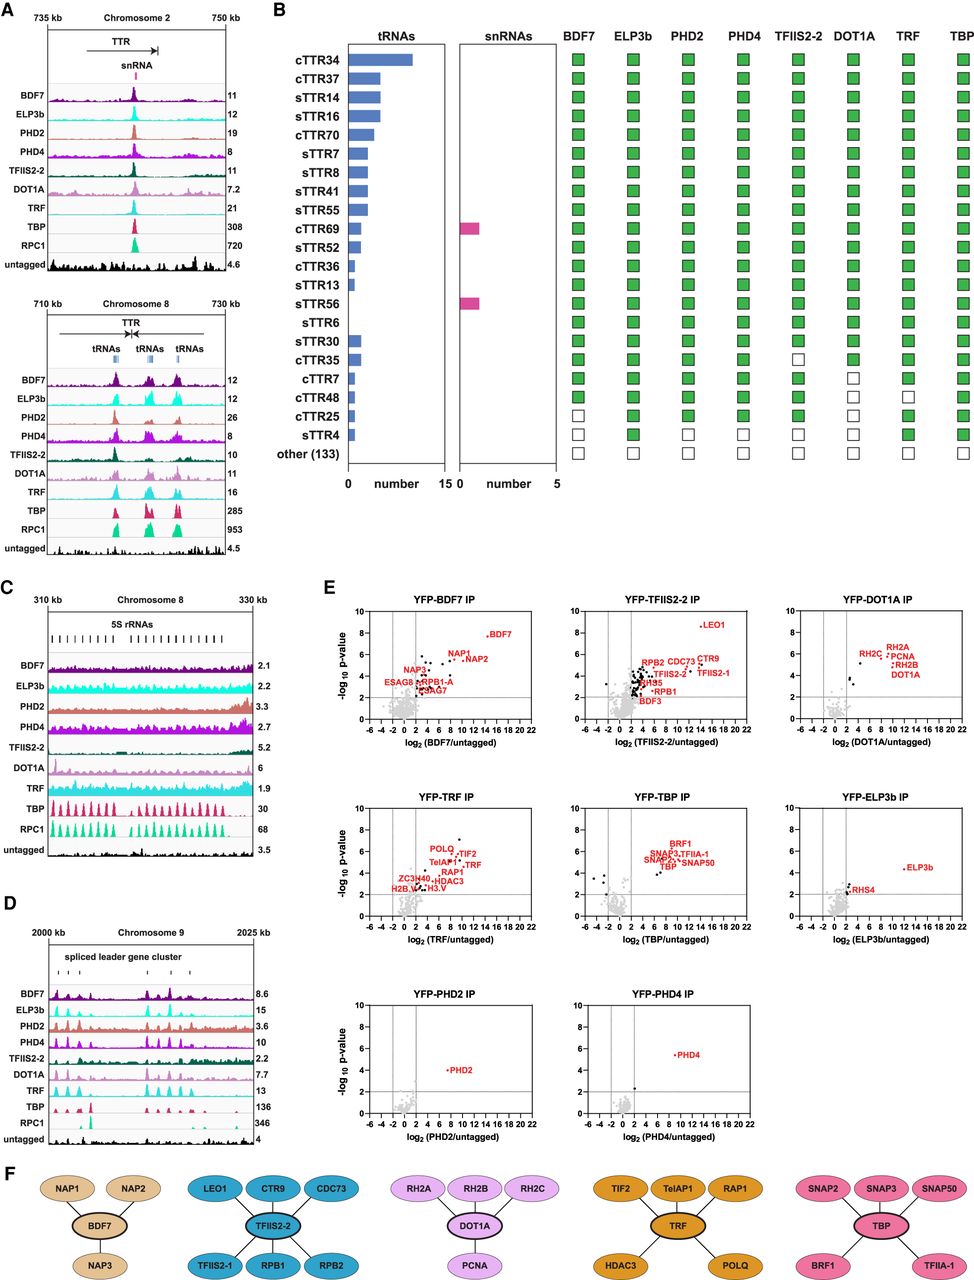
Proteins enriched over RNAPII TTRs coinciding with RNAPIII-transcribed genes define distinct interaction networks. The ChIP-seq tracks show a single replicate for each protein and are scaled separately as reads per million (values shown at the end of each track). (A) Examples of protein enrichment over an snRNA (top panel) and tRNAs (bottom panel). (B) Overlap between TTRs, tRNAs, snRNAs, and RNAPIII/TTR-associated factors. The numbers under the horizontal bar graphs refer to the number of tRNA or snRNA genes overlapping with each TTR. The presence and absence of overlap with RNAPIII/TTR-associated factors is indicated by green and empty squares, respectively. (cTTRs) Convergent TTRs, (sTTRs) single TTRs. (C) Enrichment of the RNAPIII/TTR-associated factors and RPC1 at the 5S rRNA gene cluster. (D) Enrichment of the RNAPIII/TTR-associated factors and RPC1 at the spliced leader gene cluster. (E) YFP-tagged proteins found to be enriched at a subset of TTRs were analyzed by LC-MS/MS to identify their protein interactions. The data for each plot are based on three biological replicates. Cutoffs used for significance: log2 (tagged/untagged) >2 or <−2 and P < 0.01 (Student's t-test). Enrichment scores for proteins identified in each affinity selection are presented in Supplemental Table S4. Significantly enriched proteins are indicated by black or colored dots. Proteins of interest are indicated by the red font. (F) Key proteins identified as being associated with the indicated YFP-tagged bait proteins (thick oval outlines). Lines denote interactions between proteins.


