
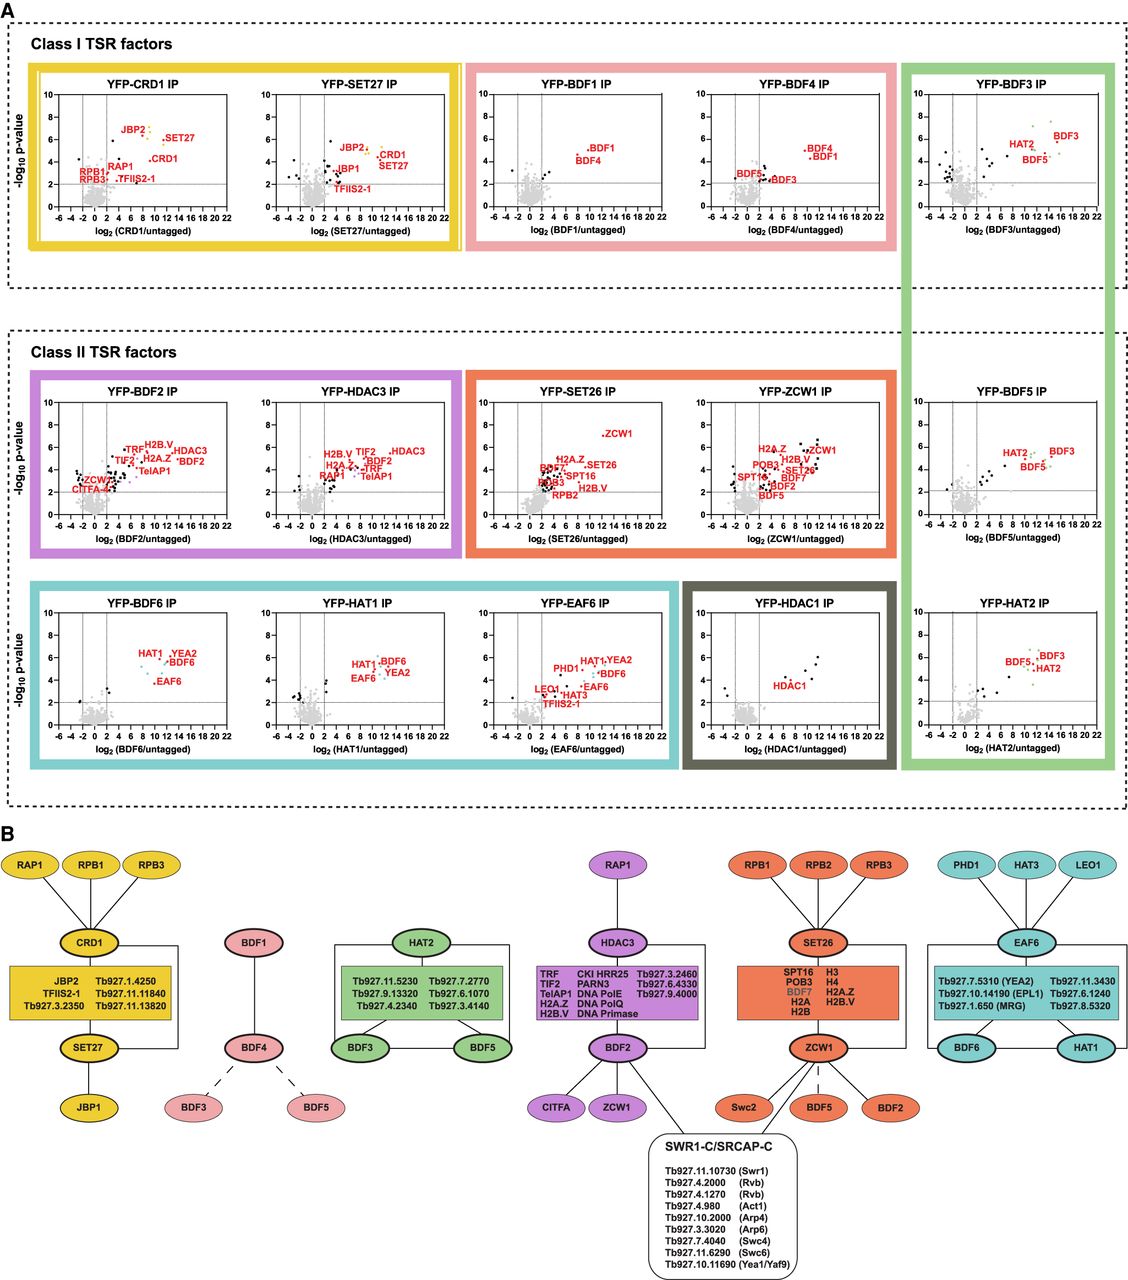
Class I and Class II TSR-associated factors define distinct interaction networks. (A) YFP-tagged proteins found to be enriched at TSRs were analyzed by LC-MS/MS to identify their protein interactions. The data for each plot is based on three biological replicates. Cutoffs used for significance: log2 (tagged/untagged) >2 or <−2 and P < 0.01 (Student's t-test). Enrichment scores for proteins identified in each affinity selection are presented in Supplemental Table S4. Plots in the same box show reciprocal interactions. Proteins of interest are indicated by the red font. Uncharacterized proteins common to several affinity selections are depicted in yellow, green, purple, and cyan. Black squares represent members of the SWR1/SRCAP complex found in the BDF2 and ZCW1 affinity selections. (B) Key proteins identified as being associated with the indicated YFP-tagged bait proteins (thick oval outlines). Rectangles contain proteins common to several affinity purifications. Lines denote interactions between proteins. The interactions of BDF3 and BDF5 with BDF4 (dashed lines); BDF5 with ZCW1 (dashed lines); and BDF7 (gray) with ZCW1 and SET26 were not confirmed by reciprocal affinity selections.


