
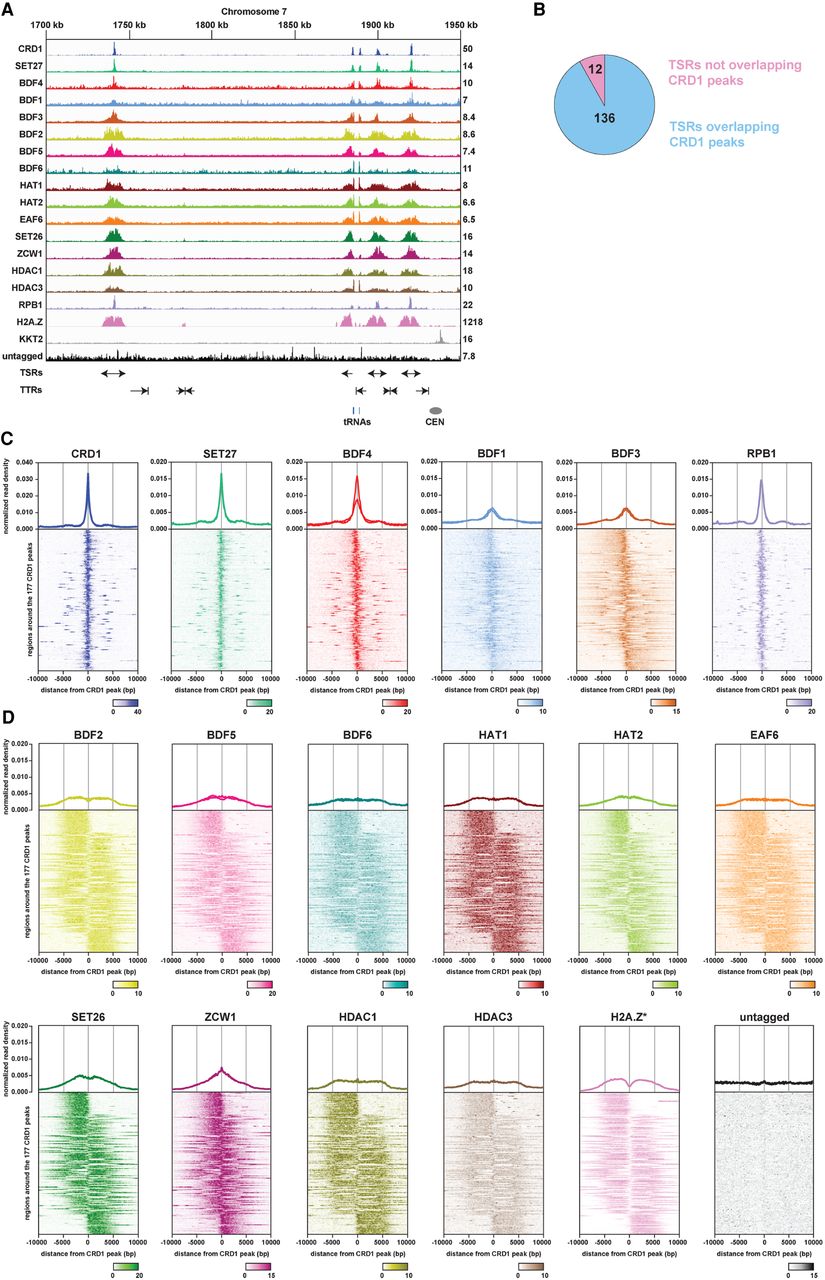
ChIP-seq reveals two classes of proteins at T. brucei transcription start regions (TSRs). (A) A region of Chromosome 7 (coordinates as indicated; kilo bases) is shown with ChIP-seq reads mapped for the indicated proteins. A single replicate is shown for each protein. Tracks are scaled separately as reads per million (values shown at the end of each track). The kinetochore protein KKT2 is included as a positive control and is enriched at centromeric regions. ChIP-seq performed in Lister 427 cells expressing no tagged protein (untagged) provides a negative control. ChIP-seq profiles for the different proteins are ordered according to their patterns. Previous H2A.Z data (Wedel et al. 2017) and our RPB1 ChIP-seq allowed TSRs to be identified. No input data were available for the normalization of H2A.Z reads, resulting in a higher read scale. The position of bidirectional/divergent and unidirectional/single TSRs is indicated with arrows showing the direction of transcription. The position of convergent and single transcription termination regions (TTRs) is shown with arrows indicating the direction from which transcription is halted. The position of tRNA genes (blue bars) and the Chromosome 7 centromere (CEN; gray oval) are marked. Positions of the various genomic elements (TSRs, TTRs, tRNAs, CEN) were obtained from annotations of the Lister 427 genome (Müller et al. 2018). (B) Most TSRs annotated in the Lister 427 genome overlap with YFP-CRD1 ChIP-seq peaks. (C) Enrichment profiles of Class I TSR factors. The metagene plots (top) show normalized read density around all CRD1 peak summits, with individual replicates for each protein shown separately. Note the different scale for CRD1. The heatmaps (bottom) are an average of all replicates for each protein and show protein density around individual CRD1 peaks. Scale bars, reads that were normalized to input and library size. (D) As in C, for Class II TSR factors.


