
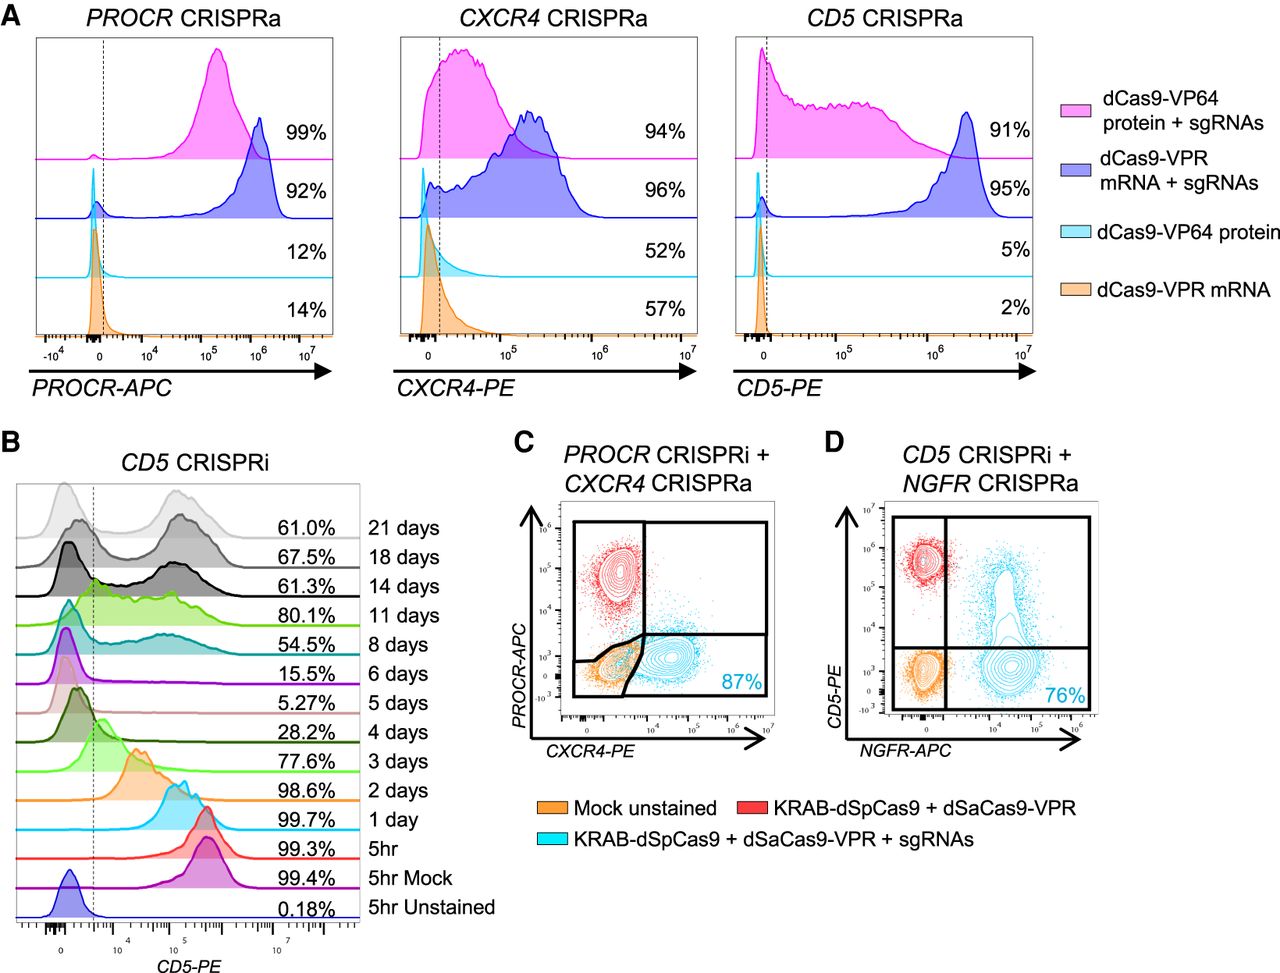
CRISPRa by RNP delivery and CRISPRi for orthogonal gene regulation. (A) Comparison of RNP- and RNA-based delivery for CRISPRa of PROCR, CXCR4, or CD5. CD34+ HSPCs were electroporated with dCas9-VPR mRNA and chemically modified sgRNAs or dCas9-VP64 protein precomplexed with chemically modified sgRNAs. Representative FACS histograms show expression levels of the target genes 24 h after electroporation as well as frequencies of surface marker–positive cells. The vertical dashed lines represent the gate for surface marker expression. All plots are representative, and the number of replicates and donors used are shown in the associated data presented in Supplemental Figure 6. (B) Time course experiment of CRISPRi in primary human T cells. Cells were electroporated with KRAB-dCas9 mRNA and three chemically modified sgRNAs targeting the TSS region of CD5. CD5 expression was analyzed by flow cytometry at the indicated time points. The vertical dashed line indicates the threshold for marker-positive cells. (C) Orthogonal transcriptional gene regulation in K562 cells by electroporation with KRAB-dSpCas9 mRNA and three sgRNAs targeting the TSS region of PROCR (CRISPRi) together with dSaCas9-VPR mRNA and two sgRNAs targeting the TSS region of CXCR4 (CRISPRa). The overlay FACS plot shows analysis at day 3 post electroporation of an unstained mock sample (orange), a stained sample only receiving the two mRNAs (red), and a stained sample receiving the two mRNAs and sgRNAs (blue). For the orthogonal CRISPRa + i condition (blue), the percentage of cells in the lower right quadrant is shown in blue. (D) Orthogonal transcriptional gene regulation in primary human T cells performed as in C, but instead targeting CD5 (CRISPRi) and NGFR (CRISPRa). All plots are representative, and the number of replicates and donors used are shown in the associated data presented in Supplemental Figures 8, 10, and 11.


