
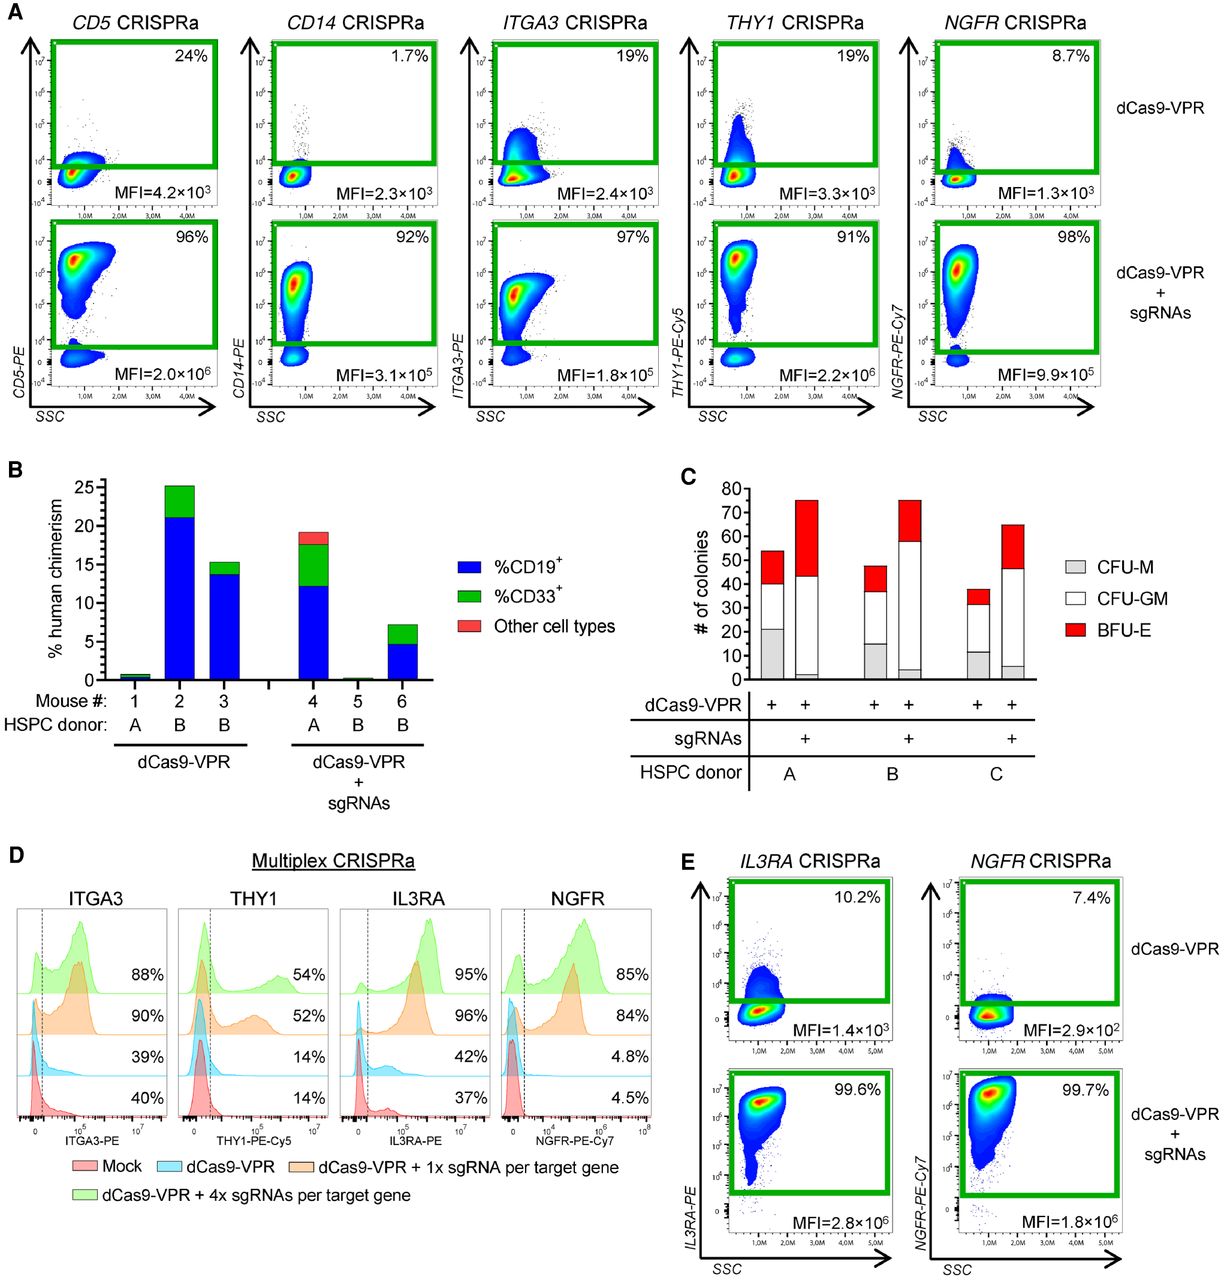
CRISPRa in human CD34+ HSPCs. (A) CRISPRa in human CD34+ HSPCs electroporated with dCas9-VPR mRNA and chemically modified sgRNAs (three to four sgRNAs per gene). Representative FACS plots are shown with the gates containing surface marker–positive cells 24 h post electroporation and the frequencies of cells within the gates are shown. Each FACS plot also displays the MFI of all live cells. (B) To confirm maintained repopulation potential of human CD34+ HSPCs following CRISPRa, CD34+ HSPCs from two cord blood donors (A and B) were electroporated with dCas9-VPR mRNA with or without three chemically modified sgRNAs targeting PROCR and then transplanted into irradiated immunodeficient NOG mice. Twenty weeks after transplant, bone marrow of the transplanted mice was analyzed by flow cytometry for human chimerism and multilineage reconstitution (CD33+ myeloid cells and CD19+ B cells). Graphs show the percentage of human chimerism for individual mice with the fraction of myeloid cells, lymphoid cells, and other cell types shown within each bar. Each bar represents one mouse. (C) Colony-forming unit (CFU) assay of CD34+ HSPCs from three donors with or without CRISPRa of the GATA1 gene. HSPCs were seeded in semisolid methylcellulose media 24 h after electroporation, and colonies were counted and scored 14 d after. (CFU-M) Monocyte colonies, (CFU-GM) granulocyte/macrophage colonies, (BFU-E) burst-forming unit erythroid colonies. (D) Multiplex CRISPRa in human CD34+ HSPCs with simultaneous gene activation of four different surface markers. Representative FACS histograms show surface marker expression 24 h after electroporation with dCas9-VPR mRNA and chemically modified sgRNAs (one or four sgRNAs per gene). The vertical dashed lines indicate the threshold for gating marker–positive cells. (E) CRISPRa in primary human T cells. Representative FACS plots show surface marker expression 24 h after electroporation with dCas9-VPR mRNA and chemically modified sgRNAs (four sgRNAs per gene). All FACS plots are representative, and the number of replicates and donors used are shown in the associated data presented in Supplemental Figures 3 through 5.


