
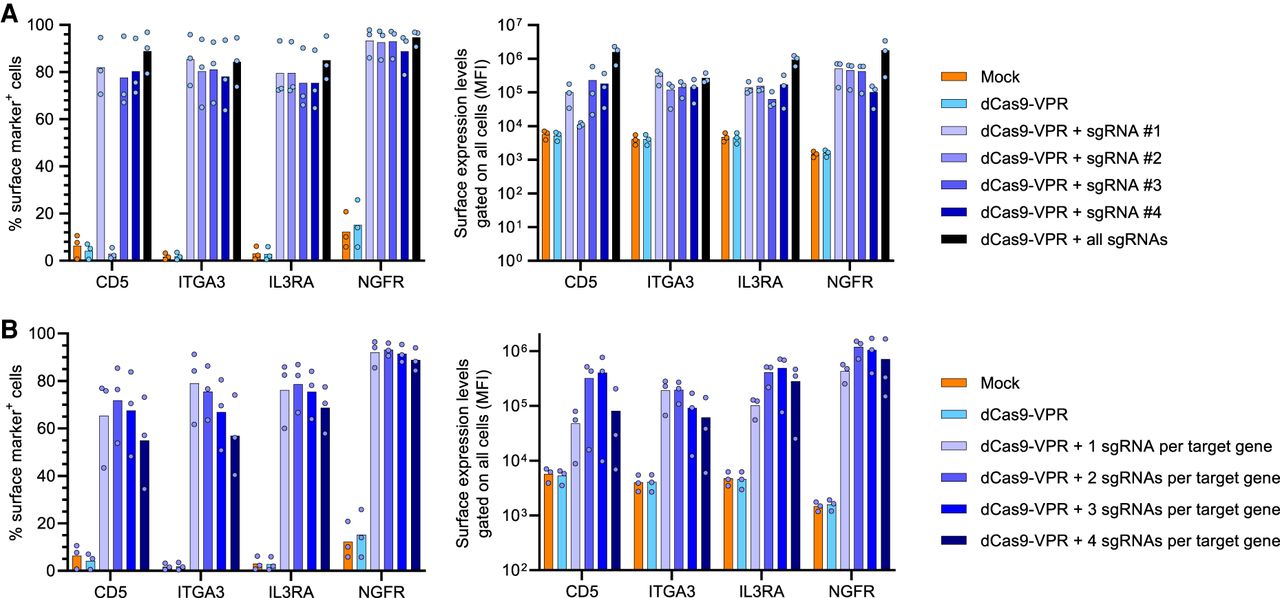
Activity of individual sgRNAs and multiplexed CRISPRa. (A) K562 cells were electroporated with dCas9-VPR mRNA and one of four individual sgRNAs targeting the TSS region of the genes CD5, ITGA3, IL3RA, and NGFR. The percentages of surface marker–positive cells (left) and the MFI of all live cells (right) were determined 24 h after electroporation by flow cytometry. (B) Multiplexed CRISPRa was investigated by electroporating K562 cells with dCas9-VPR mRNA and one, two, three, or all sgRNAs per target gene. sgRNA combinations were selected based on decreasing potency from the experiment shown in A; that is, when a single sgRNA was used for each gene, this was the most potent sgRNA as identified in A. The percentage of surface marker–positive cells (left) and the MFI of all live cells (right) were determined 24 h after electroporation by flow cytometry. For all graphs, N is the number of data points. All bars show mean values with individual data points plotted.


