
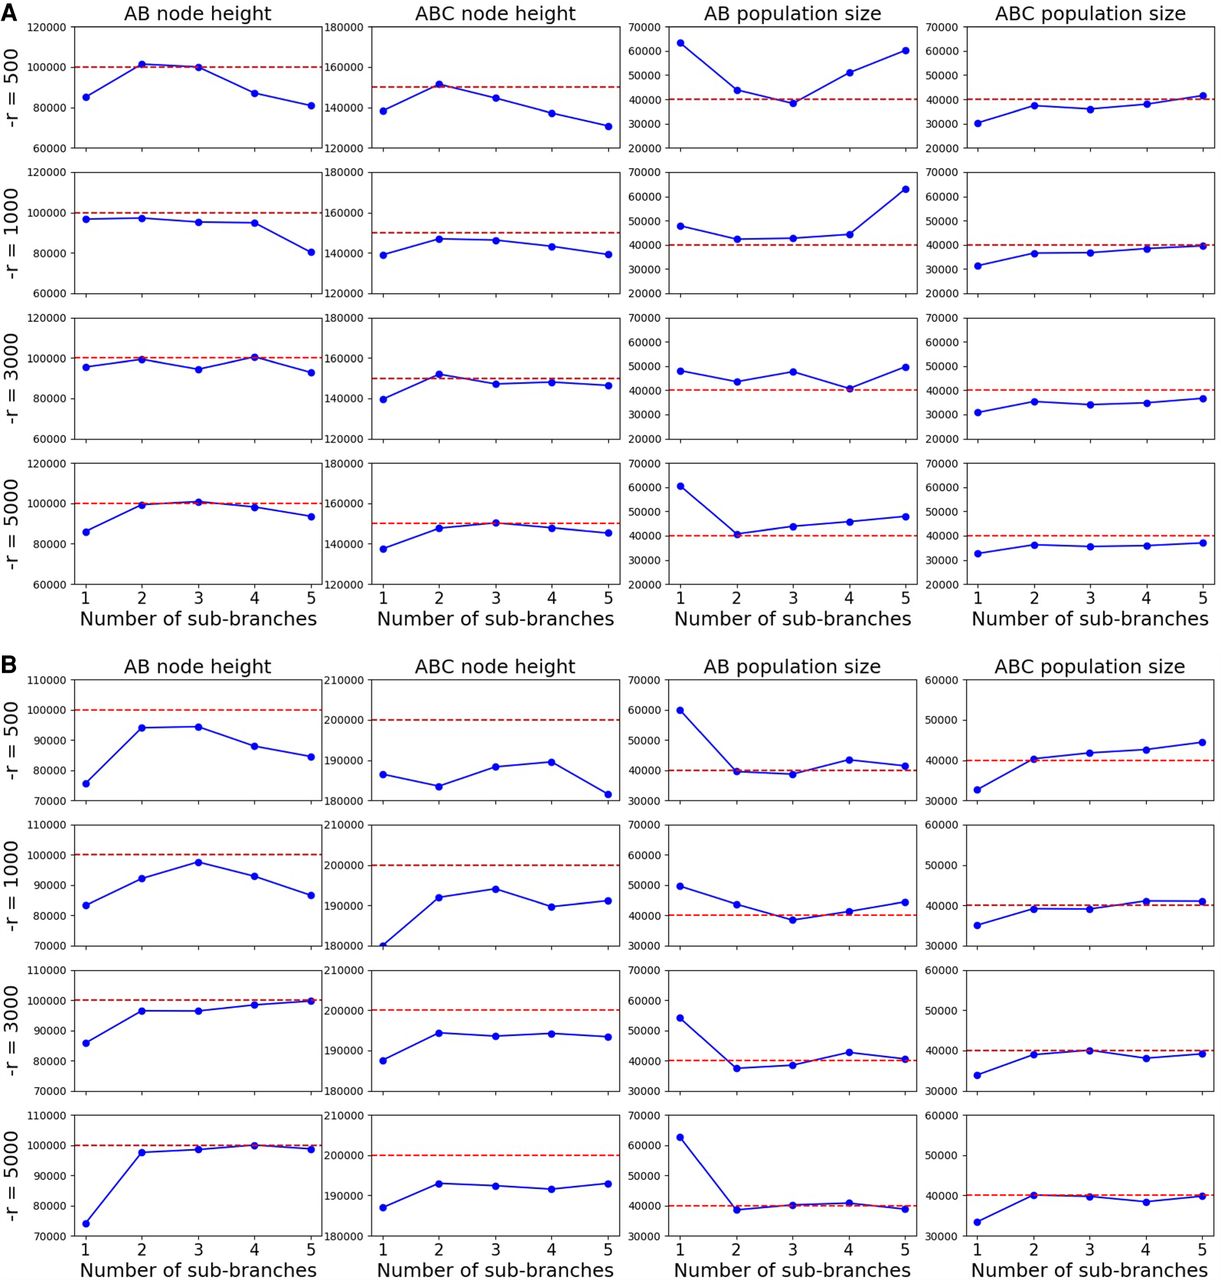
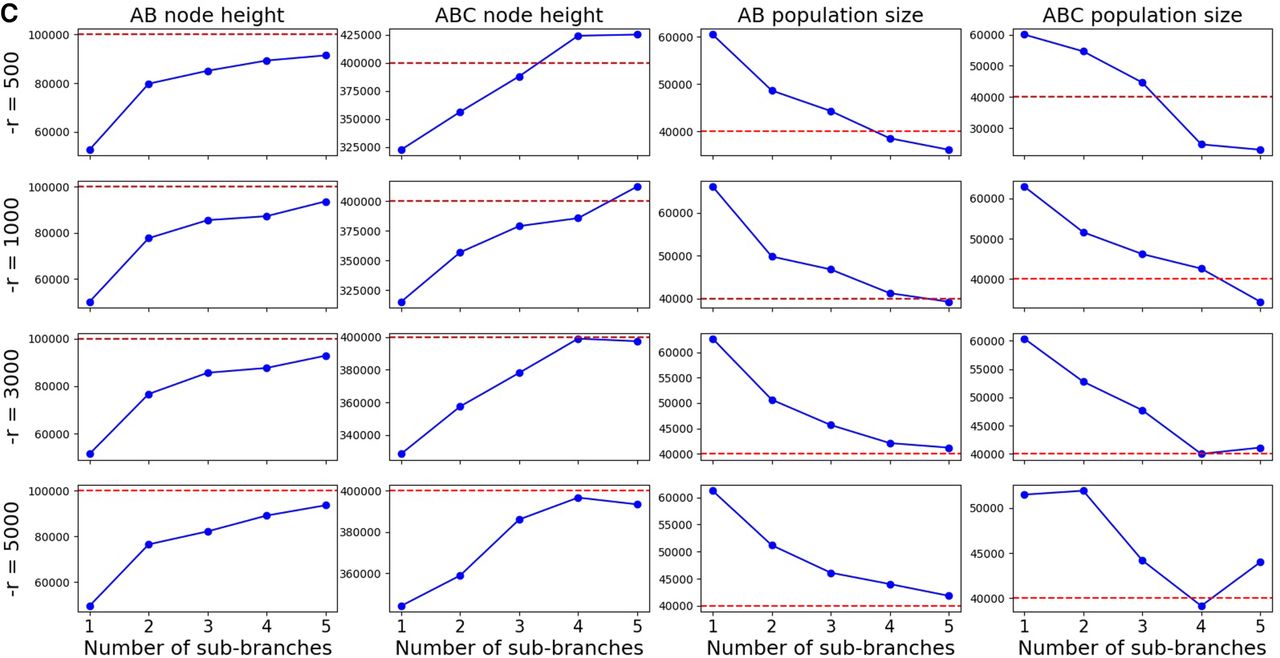
Figure 5.
Results on the three scenarios, shown for internal branch lengths 0.625 (A), 1.25 (B), and 3.75 (C). Dashed red lines are true values. Blue lines are inferred MAP values. Rows correspond to different simulation lengths. Columns correspond to different continuous parameters. The x-axes are number of sub-branches ranging from one to five. (Figure continued on following page.)


