
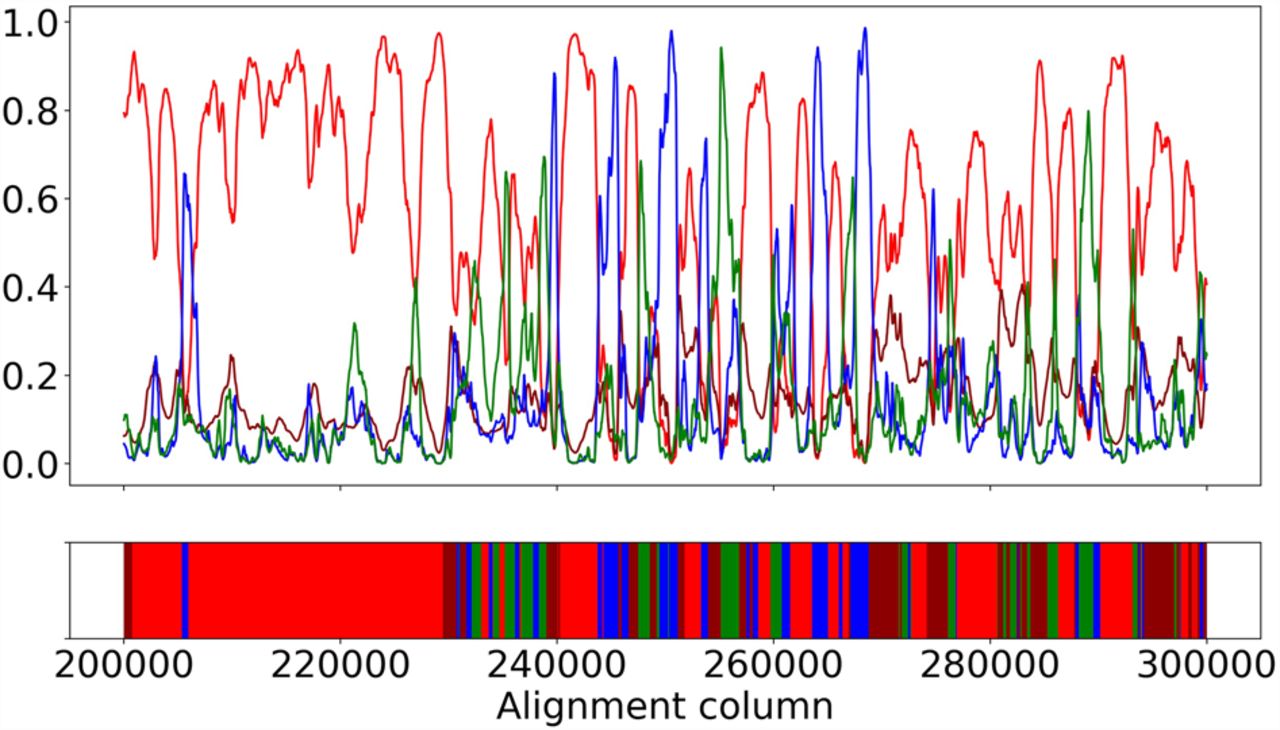
Figure 4.
True genealogy and posterior distribution along the sequence. The upper panel shows posterior probability of each genealogy at each site. The lower panel shows the true genealogy of each site. Coloring corresponds to different genealogies: Genealogy HC1 is in red, HC2 is in dark red, HG is in blue, and CG is in green.


