
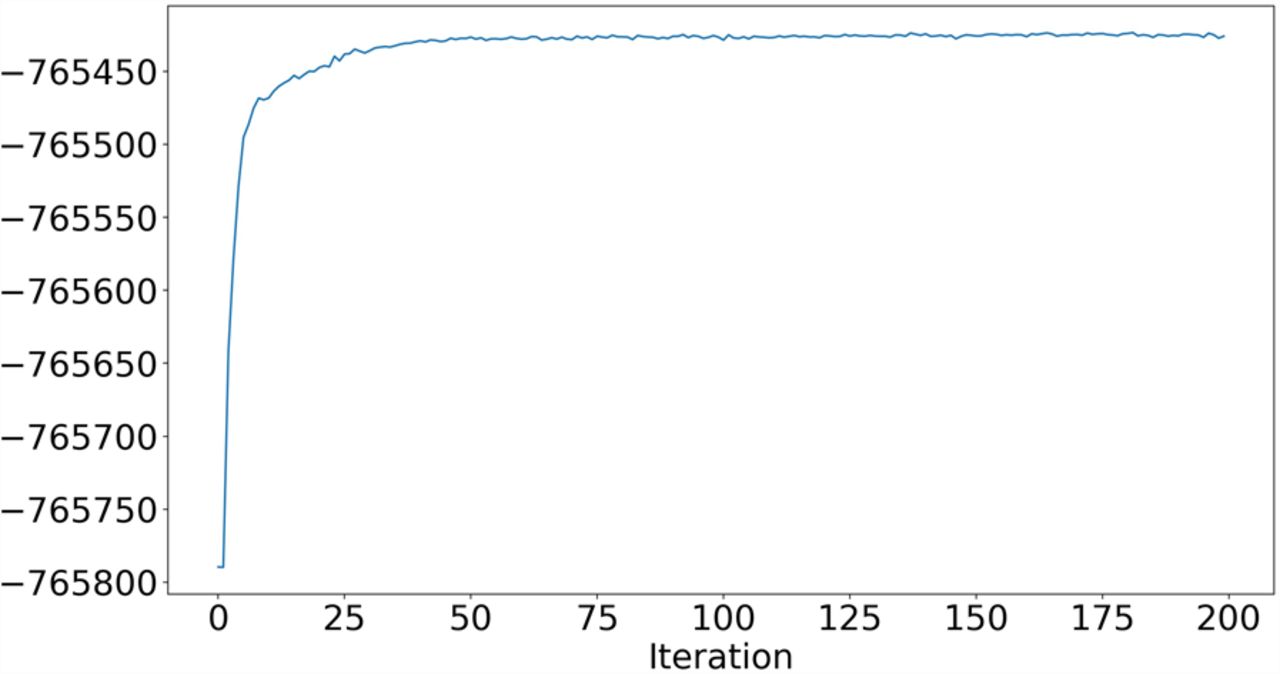
Figure 3.
Convergence of VICAR. The x-axis is the number of iterations, and the y-axis is the log likelihood of the current estimation.
(Downloading may take up to 30 seconds. If the slide opens in your browser, select File -> Save As to save it.)
Click on image to view larger version.
Convergence of VICAR. The x-axis is the number of iterations, and the y-axis is the log likelihood of the current estimation.
 CiteULike
 Delicious
 Digg
Digg Facebook
 Google+
 Reddit
 Twitter
