
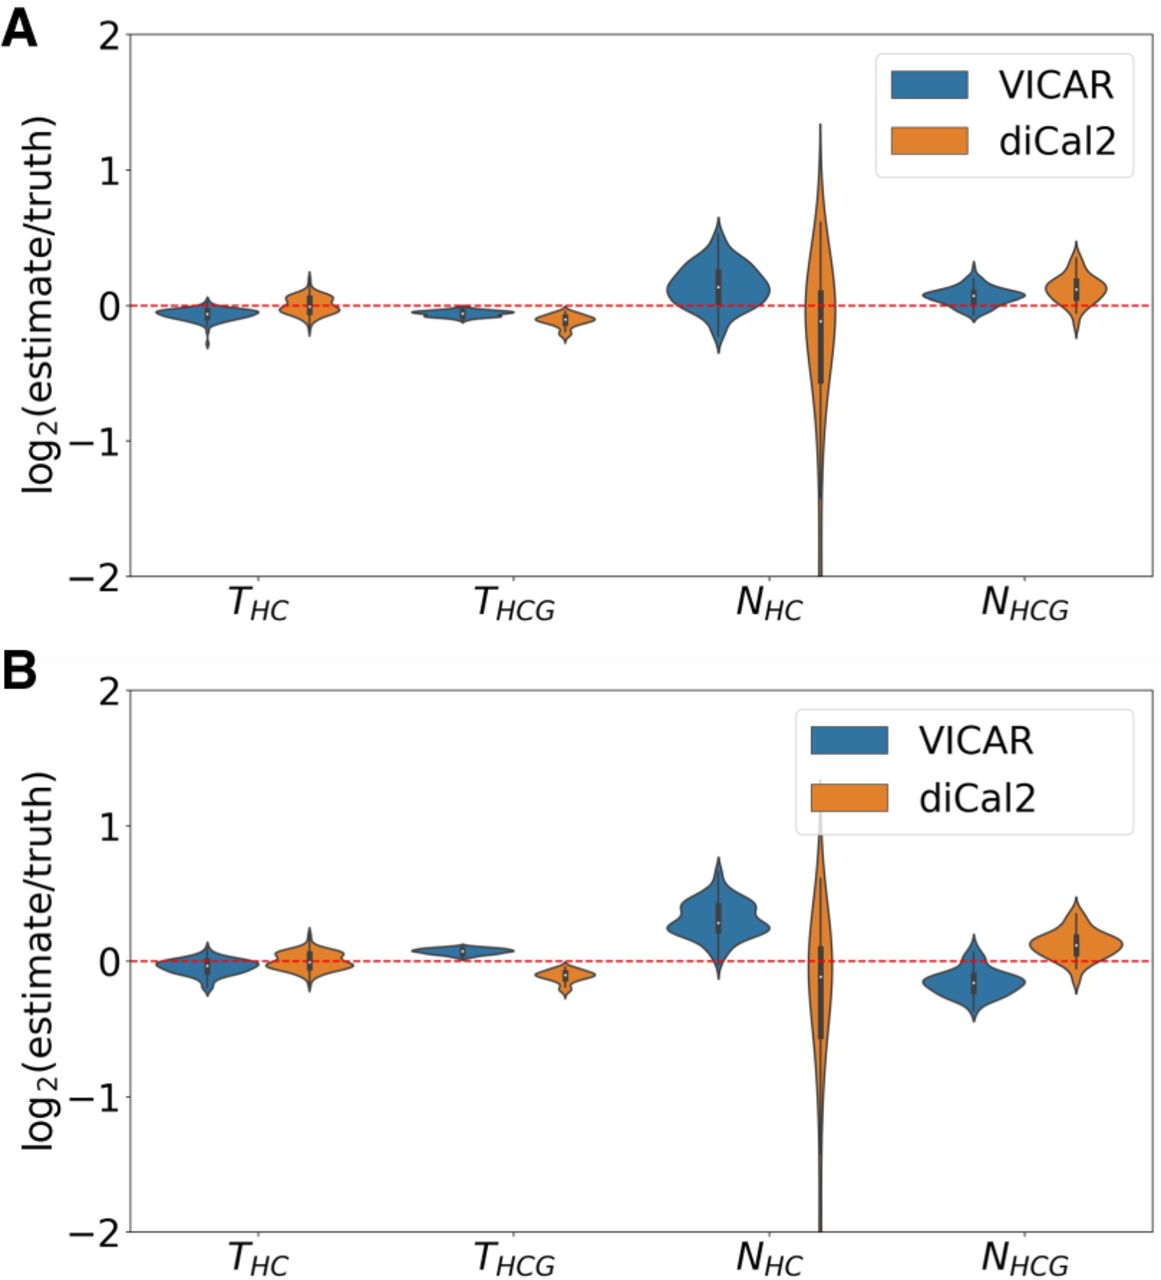
Figure 2.
Accuracy results of VICAR (blue) and diCal2 (orange) on simulated human–chimp–gorilla data sets. The violin plot shows the base-2 logarithm of the relative error (estimate/truth) for the analysis of 100 data sets by VICAR and diCal2. A value of zero (the red dashed line) represents an exact estimate. The two panels show the results based on different values of the number of iterations of variational inference in VICAR (the parameter T in Algorithm 2 in Methods). (A) T = 200. (B) T = 20.


