
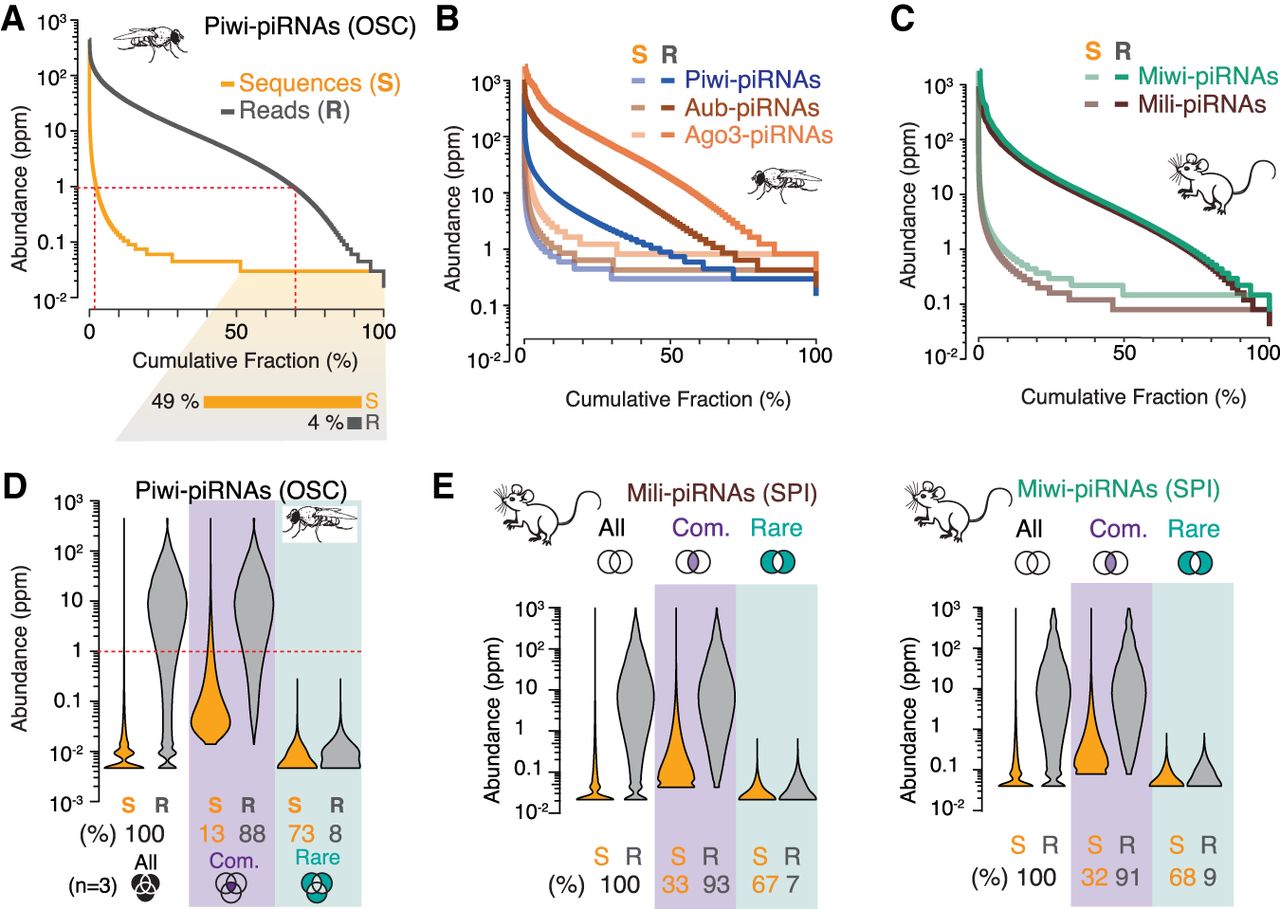
A skewed distribution of sequence abundance results in a few common and many rare piRNAs. The abundance of individual piRNA sequences (Abundance) varies by ∼1000-fold—ranging from ∼0.1 to more than 1000 reads per million (ppm)—in flies (A,B) and mice (C) (n = 1). (A) Individual Piwi-piRNA sequences from OSCs (S, orange) were ranked by their abundance in reads per million (Supplemental Table S2) (n = 1). Cumulative distribution of corresponding reads (R, gray). The fraction of sequences that is only represented by a single molecule in a representative data set is indicated below. (B) Sequence abundance and cumulative read distribution as in A for piRNAs that were associated with Piwi, Aubergine (Aub), and Argonaute 3 (AGO3) in Drosophila ovaries (GEO: GSE83698), and (C) Mili/Piwil2 and Miwi/Piwil1 in murine primary spermatocytes (SPI) (BioProject: PRJNA421205). (D) Only 13% of the most abundant sequences can be commonly found in three independent data sets but make up 88% of all sampled piRNAs. Violin plots depict the abundance of individual sequences (S) and cumulative reads (R) for Piwi-piRNAs in three biological data sets. Common piRNA sequences are found in all three replicates (purple). Rare piRNAs are only observed in one of the three samples (teal). Schematic Venn diagrams indicate the intersecting sets (n = 3) (Supplemental Table S2). (E) Common and rare piRNAs (analysis as in D) from the intersection of two biological replicates (n = 2) for Mili- and Miwi-piRNAs from murine primary spermatocytes (BioProject: PRJNA421205).


