
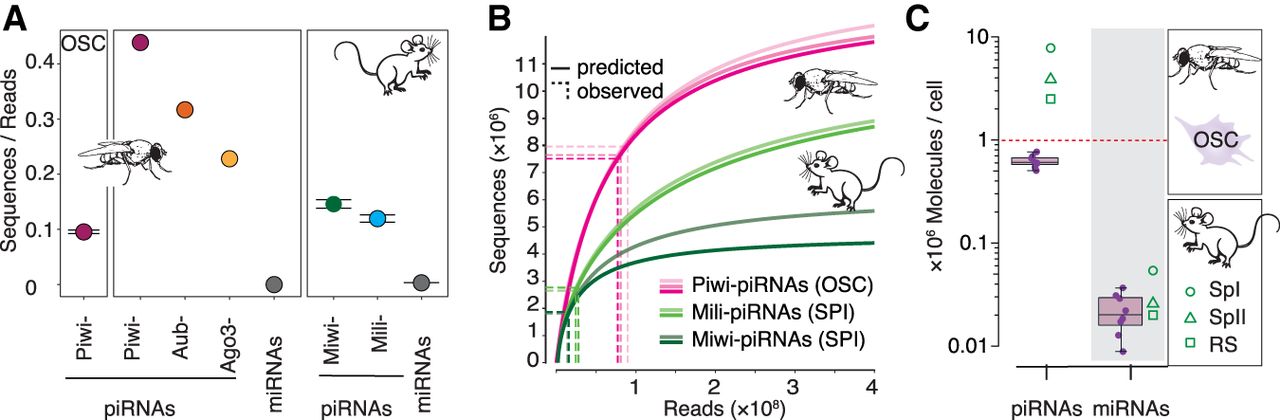
The sequence diversity of piRNAs exceeds the capacity of an individual cell and generates cell-to-cell variability. (A) Sequence diversity (sequences/reads) of piRNAs associated with different PIWI proteins in flies and mice. Piwi-piRNAs in ovarian somatic sheath cells (OSCs) (mean ± SD, n = 3; this study). Piwi-, Aubergine- (Aub), and Argonaute 3- (AGO3) piRNAs in Drosophila ovaries (GEO: GSE83698) (n = 1). Miwi/Piwil1- and Mili/Piwil2-piRNAs in primary spermatocytes (BioProject: PRJNA421205) (n = 2, range indicated) (Supplemental Table S1). For comparison: microRNAs (miRNAs) according to miRBase annotation from total small RNA data sets (GEO: GSE83698 and SRA: SRR3715418). (B) Prediction of piRNA populations according to species accumulation curves based on experimental sampling. Piwi-piRNAs from OSCs (this study) (n = 3) and Mili- and Miwi- piRNAs from primary spermatocytes (SPI) (n = 2) (BioProject: PRJNA421205). The number of sampled reads (x-axis) and sequences (y-axis) is indicated by dotted lines. (C) The average number of Piwi-piRNAs and miRNAs in a single cell. Numbers based on calibrated sequencing of total small RNAs from OSCs (median, 25th–75th percentile, data points for the eight biological replicates are indicated [n = 8]) (Supplemental Fig. S1C). Mouse data from primary spermatocytes (SPI), secondary spermatocytes (SPII), and round spermatids (RS) from Gainetdinov et al. (2018) are shown for comparison.


