
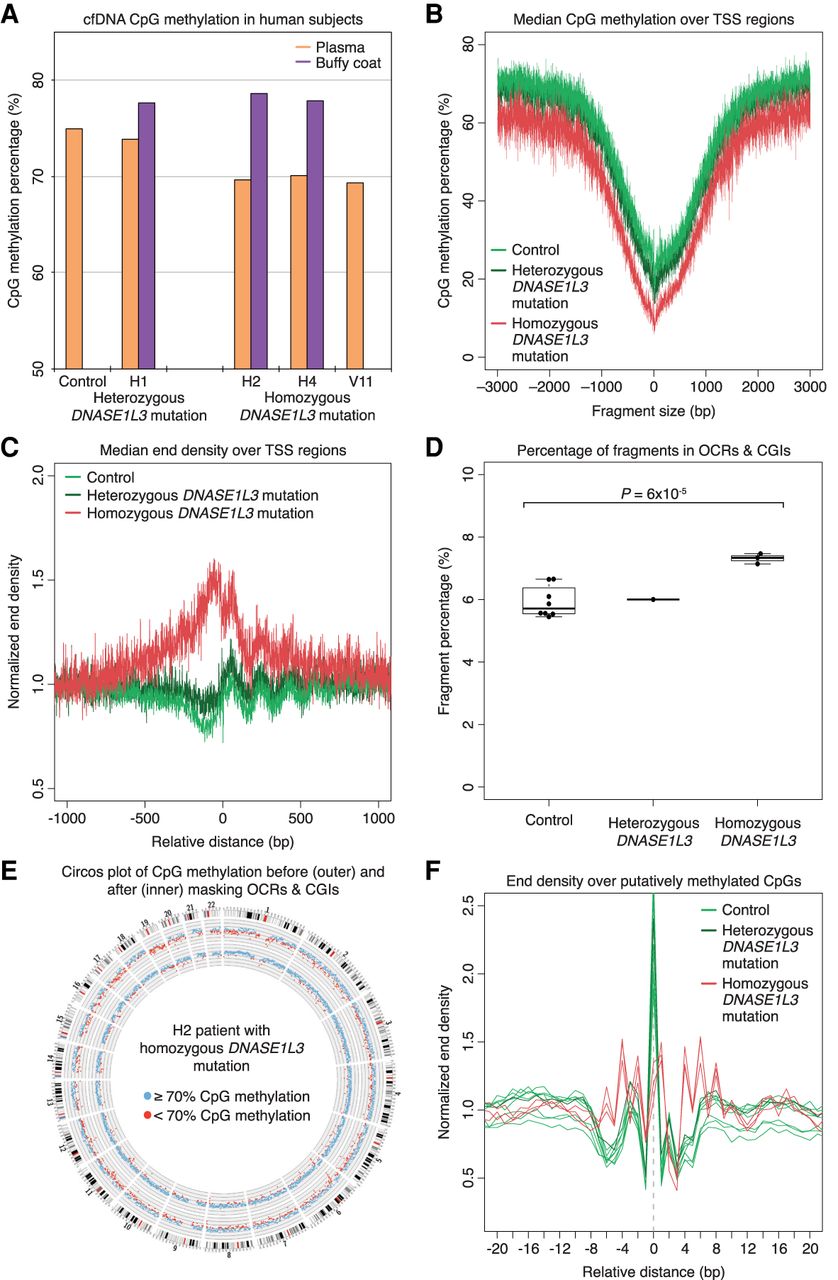
cfDNA from DNASE1L3-deficient patients mimics cfDNA from DNASE1L3-deficient mice. (A) CpG methylation percentage of the human plasma (orange) and buffy coat (purple) samples are shown. H2, H4, and V11 have the homozygous frameshift c.290_291delCA (p.Thr97Ilefs*2) DNASE1L3 mutation, and H1 is the heterozygous parent of H2 and H4. The median value of eight control samples is shown. The y-axis scale is from 50% to 85%. (B) The CpG methylation percentage of fragments from each sample was calculated over the aggregated TSS regions, and the median of each sample type is shown in a ±3000-bp window. cfDNA from DNASE1L3-deficient patients is relatively hypomethylated. The y-axis scale ranges from 0% to 80%. (C) The median normalized end density for each sample type is shown in a ±1000-bp window over the aggregated TSS region. cfDNA from DNASE1L3-deficient patients is more fragmented with more fragment ends in TSS regions. The y-axis scale ranges from 0.5% to 2%. (D) The proportion of fragments in OCR and CGI regions are shown. OCRs are defined as the regions ±500 bp around the center of TSS, H3K4me3, and H3K27ac regions. cfDNA from DNASE1L3-deficient subjects had a significantly increased proportion of OCR and CGI fragments. Welch's t-test was performed between control and DNASE1L3-deficient subjects. The y-axis scale ranges from 0% to 10%. (E) A representative Circos plots from a DNASE1L3-deficient patient showing genome-wide CpG methylation percentages before (outer ring) and after (inner ring) masking OCR and CGI fragments. Each dot represents the CpG methylation percentage in a 1-Mb bin of the mouse autosome and is colored in blue if ≥70% and in red if <70%. Masking OCR and CGI fragments diminishes the genome-wide hypomethylation in the cfDNA of DNASE1L3-deficient patients. (F) Normalized end density over putatively methylated CpGs is shown in a ±20-bp window. The identified C is placed at position 0. In control and heterozygous DNASE1L3 samples, there is a distinct preference to cut at the methylated CpG, which is lost in DNASE1L3-deficient patients. The y-axis scale ranges from 0% to 2.5%. cfDNA from control samples is in light green, the heterozygous DNASE1L3 parent is in dark green, and DNASE1L3-deficient subjects is in red.


