
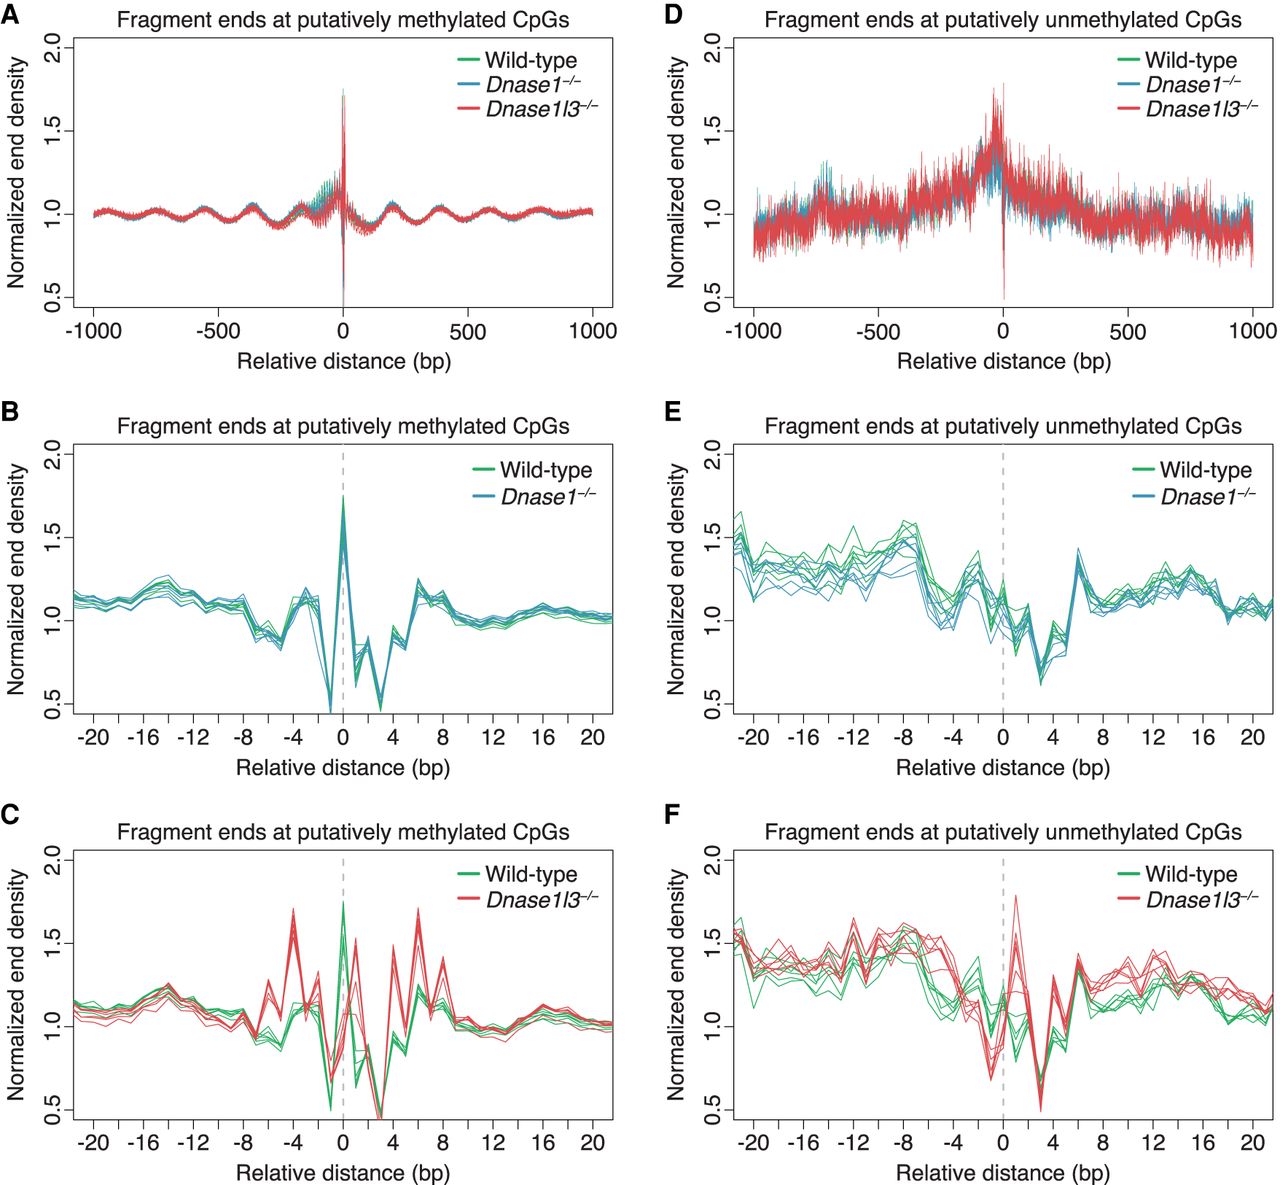
Normalized end densities over putatively methylated and unmethylated CpGs. (A–F) Putatively methylated CpGs and unmethylated CpGs were identified, and the plasma cfDNA fragment end density over these CpGs was normalized by the median end counts of the ±1000 bp region. A ±1000-bp window (A,D) and a ±20-bp window (B,C,E,F) is shown. The identified C is placed at position 0. There is substantial overlap in the normalized end density profiles among the genotypes within the ±1000 bp window (A,D). Comparisons between the normalized end density of all wild-type samples (green) and all DNASE1-deficient mice samples (blue) is shown, with substantial overlap between them (B,E). Comparisons between the normalized end density of all wild-type samples (green) and all DNASE1L3-deficient mice samples (red) is shown (C,F). In the presence of DNASE1L3, there is a distinct preference for fragments to end at methylated CpGs in the cfDNA of WT and DNASE1-deficient mice (B). In the absence of DNASE1L3, this preference for fragments to end at methylated CpGs is absent (C). There is no particular preference for fragments to end at unmethylated CpGs (E,F). The y-axis scale ranges from 0.5% to 2%.


