
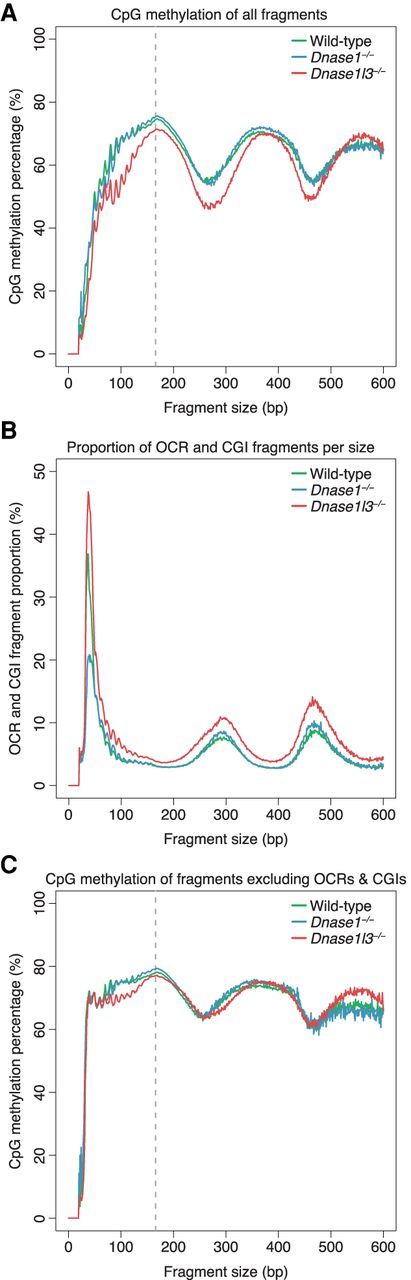
Differential methylation levels by cfDNA fragment size. (A) The CpG methylation percentage was calculated with all fragments of a particular size and the median of each genotype was plotted. A periodic pattern of methylation is shown with peaks in methylation at around 170 bp, 360 bp, and 550 bp, corresponding to sizes associated with mono-, di-, and trinucleosomes. cfDNA from DNASE1L3-deficient mice is hypomethylated from 0 to 500 bp. The y-axis scale ranges from 0% to 100%. (B) The proportion of OCR and CGI fragments within each fragment size was calculated and the median of each genotype was plotted. OCR and CGI fragments are a large proportion of fragments ≤80 bp. cfDNA from DNASE1L3-deficient mice has more OCR and CGI fragments in all fragment sizes while cfDNA from DNASE1-deficient mice has less OCR and CGI fragments in fragments ≤80 bp. The y-axis scale ranges from 0% to 50%. (C) The CpG methylation percentage for each fragment size was replotted after masking OCR and CGI fragments. The hypomethylation of cfDNA from DNASE1L3-deficient mice is diminished after masking in most size ranges, except ∼80–200 bp. The y-axis scale ranges from 0% to 100%. cfDNA from wild-type mice is in green, from DNASE1L3-deficient mice is in red, and from DNASE1-deficient mice in blue. Gray dashed line marks the 166-bp fragment size.


