
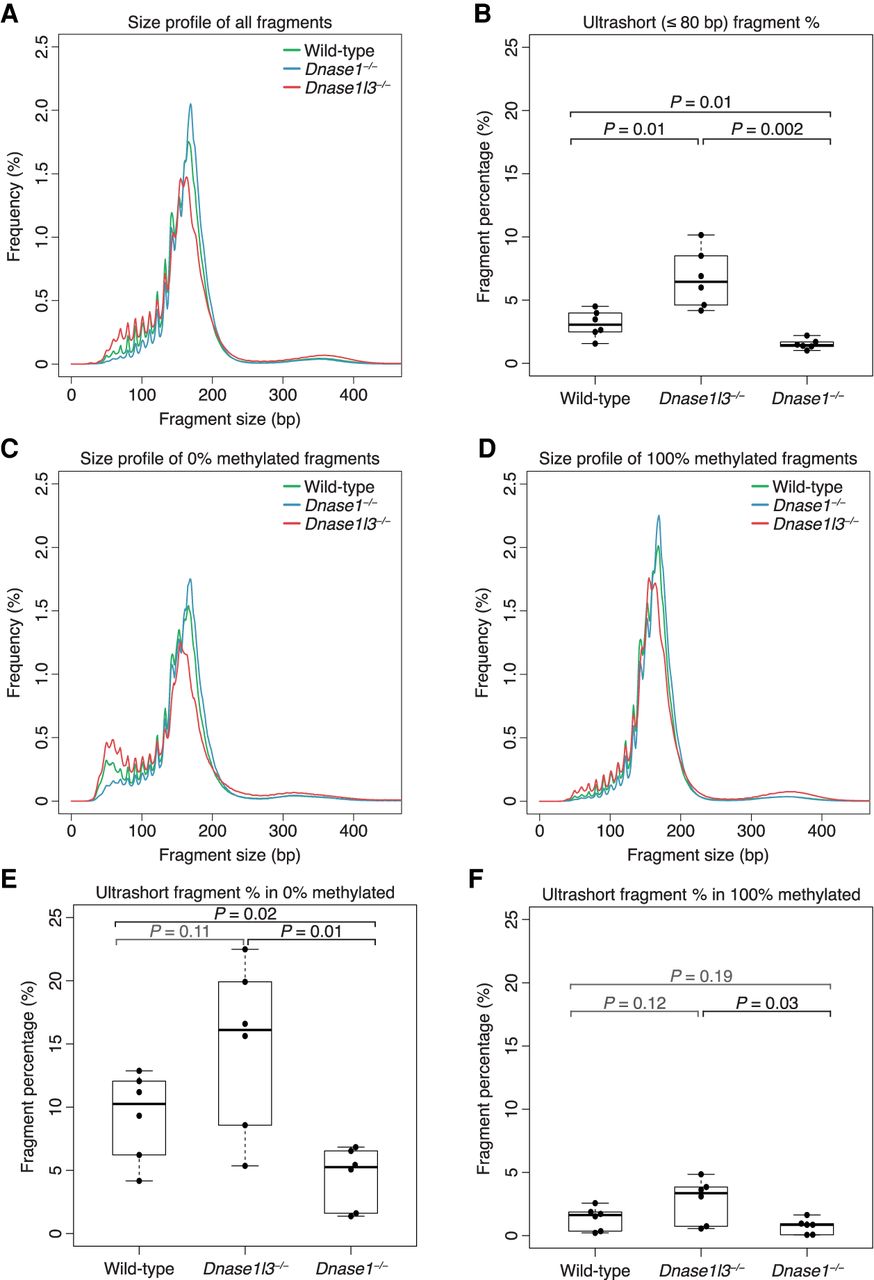
Figure 2.
cfDNA size profile is shorter in DNASE1L3-deficient mice and longer in DNASE1-deficient mice. (A,C,D) The median cfDNA size profile of each genotype was plotted using all sample fragments (A), only 0%-methylated fragments (C), or only 100%-methylated fragments (D). cfDNA from WT mice is in green, DNASE1L3-deficient mice is in red, and DNASE1-deficient mice in blue. The y-axis scale ranges from 0% to 2.5%. (B,E,F) The proportion of fragments that are ultrashort (≤80 bp) was calculated from all sample fragments (B), only 0%-methylated fragments (E), or only 100%-methylated fragments (F). Welch's t-test was performed for significance testing. Nonsignificant P-values are in gray. The y-axis scale ranges from 0% to 25%.


