
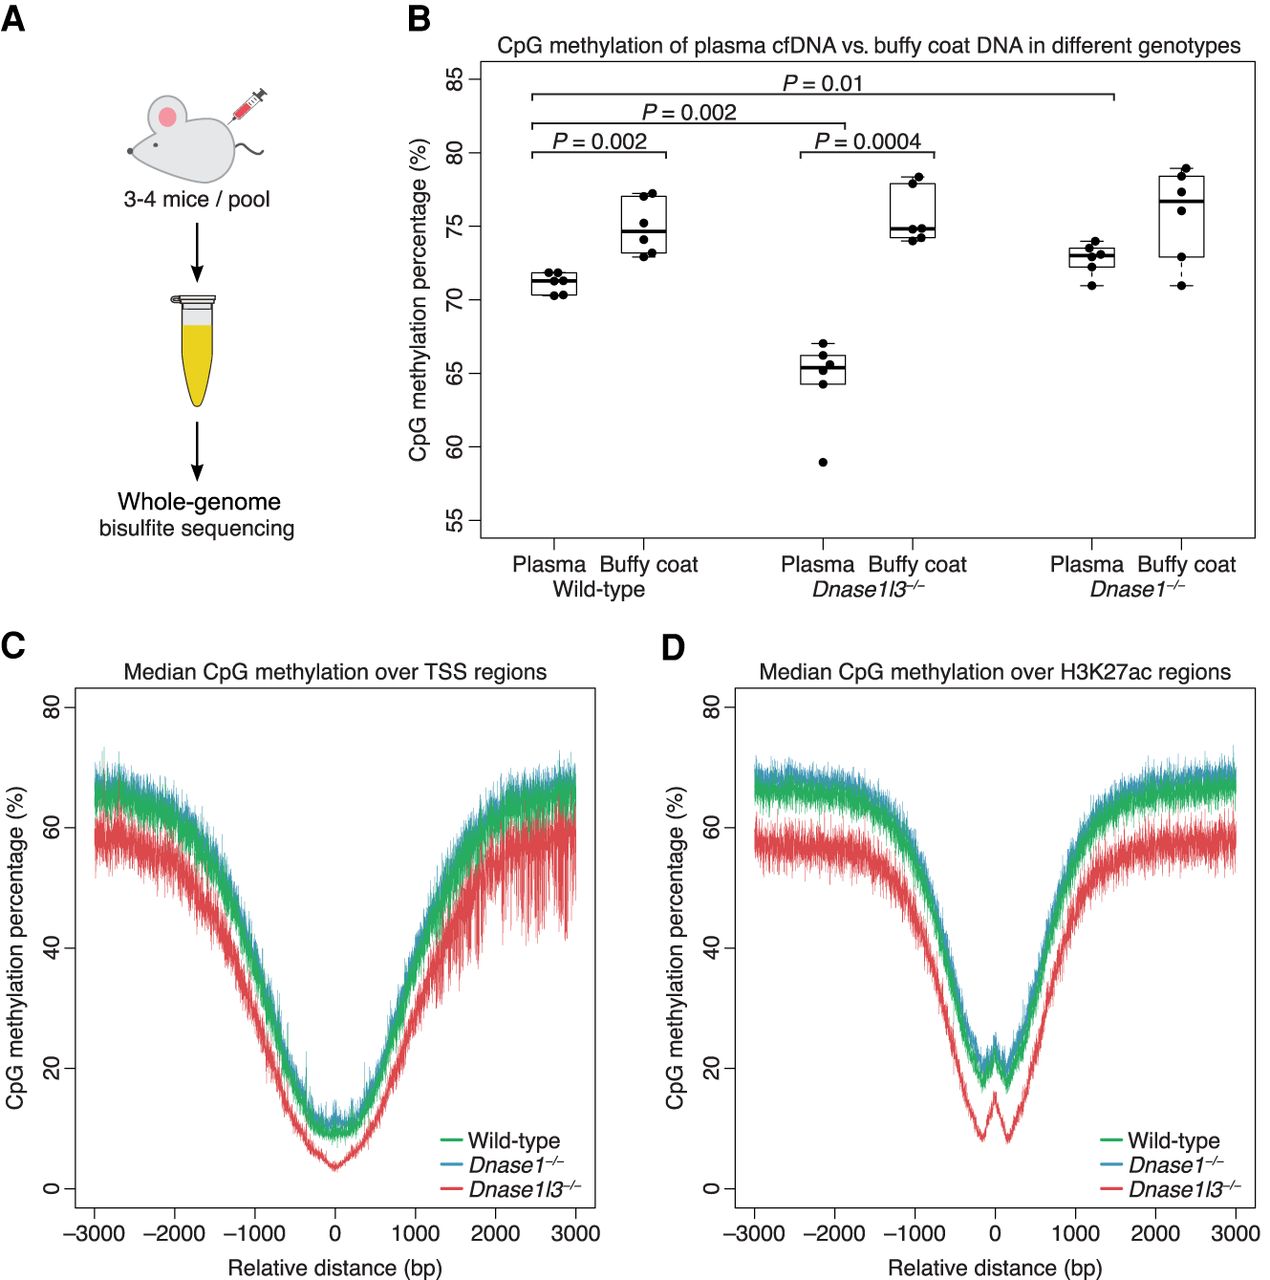
cfDNA from DNASE1L3-deficient mice is hypomethylated and cfDNA from DNASE1-deficient mice is hypermethylated on a genome-wide level. (A) Whole-genome bisulfite sequencing was performed on six pooled plasma from 20 wild-type mice, six pooled plasma from 20 DNASE1L3-deficient mice, and six pooled plasma from 20 DNASE1-deficient mice. (B) The CpG methylation percentage was calculated from all sequenced fragments in plasma cfDNA and buffy coat genomic DNA of each sample. A paired t-test was performed on paired plasma and buffy coat samples. Welch's t-test was performed on other comparisons. The y-axis scale ranges from 55% to 85%. (C,D) Transcriptional start sites (TSSs) were aggregated with the TSS placed at position 0 (C). H3K27ac regions were aggregated with the center of each region placed at position 0 (D). The CpG methylation percentage of all fragments in each sample was calculated over these aggregated regions and the median of each genotype is shown in a ±3000-bp window. cfDNA from WT mice is in green, from DNASE1L3-deficient mice is in red, and from DNASE1-deficient mice in blue. The y-axis scale ranges from 0% to 80%. cfDNA from DNASE1L3-deficient mice is hypomethylated and cfDNA from DNASE1-deficient mice is slightly hypermethylated in these regions.


