
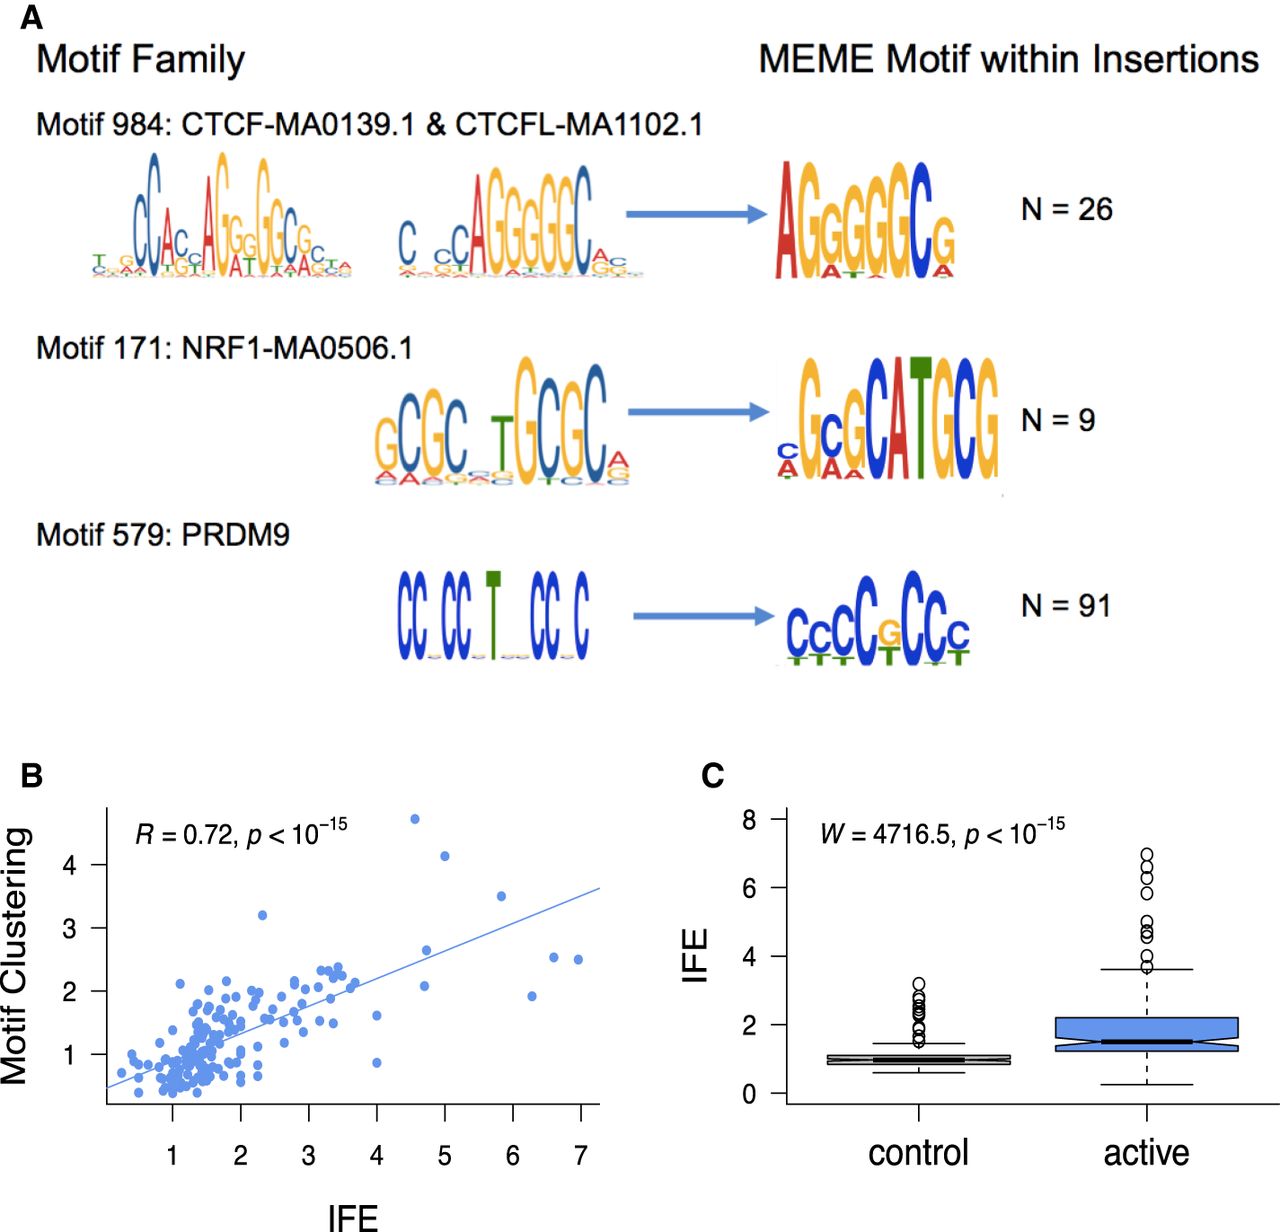
Insertions at spermatogonial TFBSs generate motif clusters in the genome. (A) JASPAR database sequence motifs identified in the footprints of spermatogonial ATAC-seq peaks (left) and the motifs identified in the singleton insertions (5–20 bp; right). The number of insertion sites (N) that were chosen by MEME to construct the motif are shown on the right. (B) For each motif family, we plot the insertion fold enrichment (IFE) on the x-axis and the degree of spermatogonial motif clustering on the y-axis; the least square regression line is indicated in blue. Motif clustering is measured as the distance to the nearest motif at spermatogonial active sites, relative to the distance for motifs at ENCODE active sites. (C) The IFE is contrasted between FIMO control motif sites (left) and spermatogonial active motif sites (right); the Wilcoxon test was performed to compare the IFE at the two classes of sites.


