
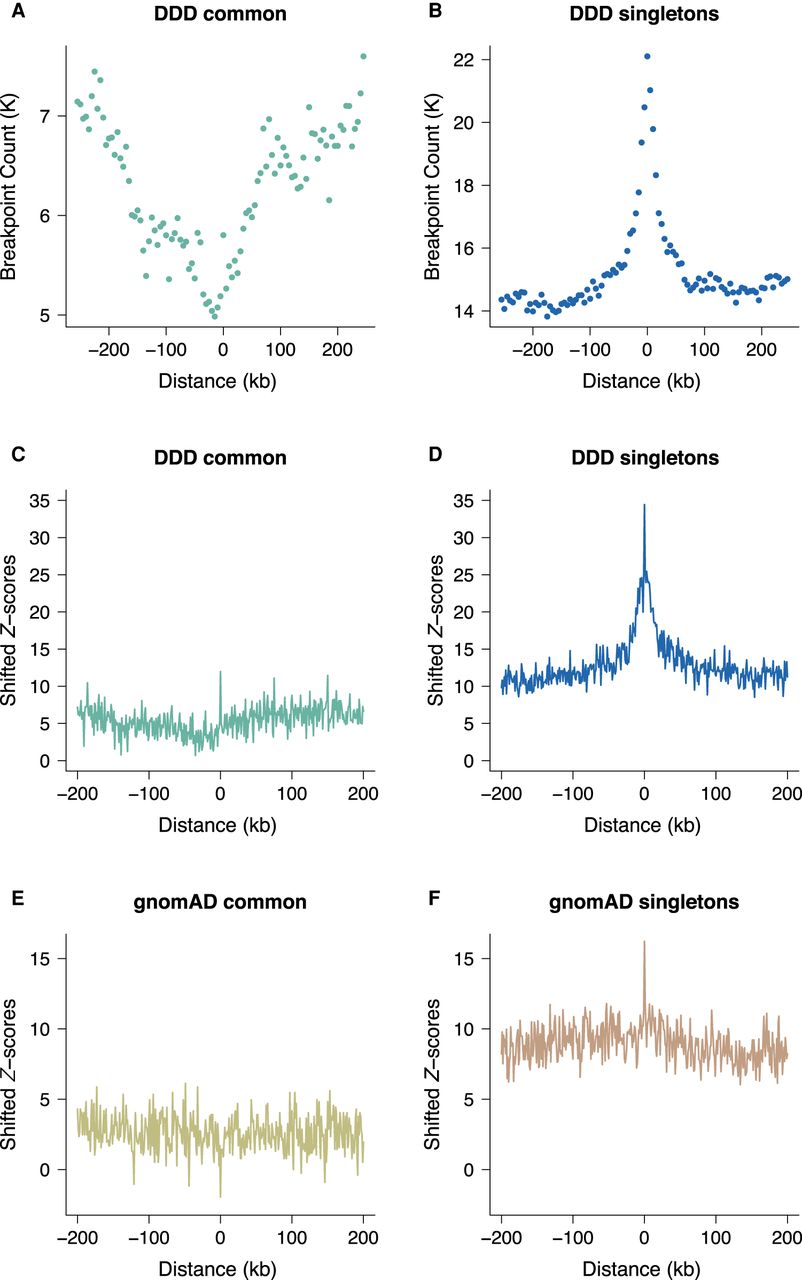
Locally elevated structural variation rates at spermatogonial regulatory sites. SV breakpoint count (A,B) and circular permutation shifted Z-scores (C,D) of deletion breakpoints in the DDD cohort, centered around the midpoints of spermatogonial ATAC-seq peaks. “Singletons” are breakpoints of deletions with a frequency of ∼ 0.002% across population samples; “common” variants are seen at a frequency of at least 1% in the DDD consensus data set (see main text); permutation P-values indicate significant enrichment for both types of variants at ATAC-seq peaks (P < 10−5 in each case). (E,F) Circular permutation shifted Z-scores of gnomAD deletion breakpoints, centered around spermatogonial ATAC-seq peaks. “Singletons” are breakpoints of deletions with a frequency of ∼0.002% across population samples; “common” variants are seen at a frequency of at least 5% in the gnomAD V.2 data set. Permutation P-values indicate significant enrichment for singleton breakpoints (P < 10−5) and a significant depletion for common variants (P < 0.01).


