
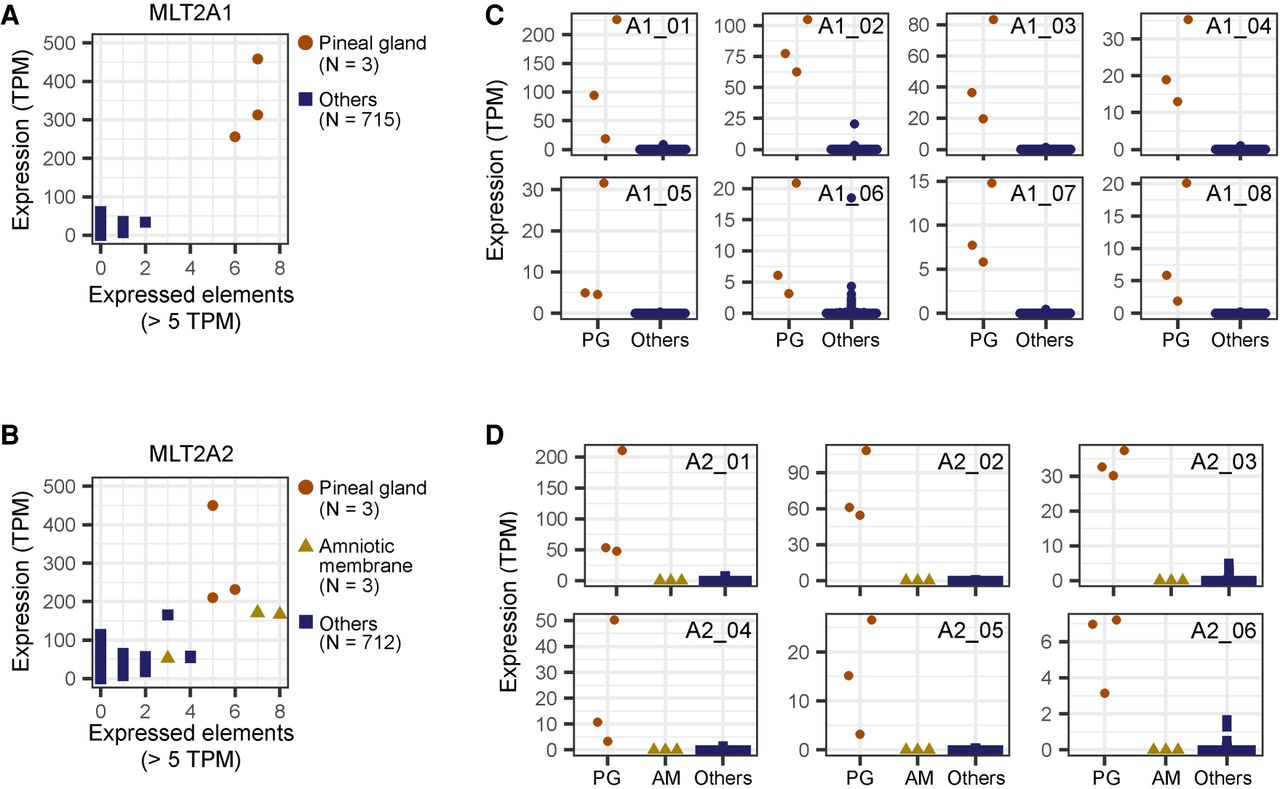
Figure 4.
Specific expression of MLT2A elements in pineal gland. (A,B) Scatter plots of 718 human samples including three pineal glands denoted by brown circles. The x-axis indicates the numbers of expressed elements, and the y-axis indicates normalized expression values, measured by CAGE (tags per million mapped tags [TPM]). (C) Normalized expression values of individual MLT2A1 elements that are actively transcribed in pineal gland. Expression values are shown separately for three pineal glands (PG) and 715 other samples. (D) Normalized expression values of individual MLT2A2 elements.


