
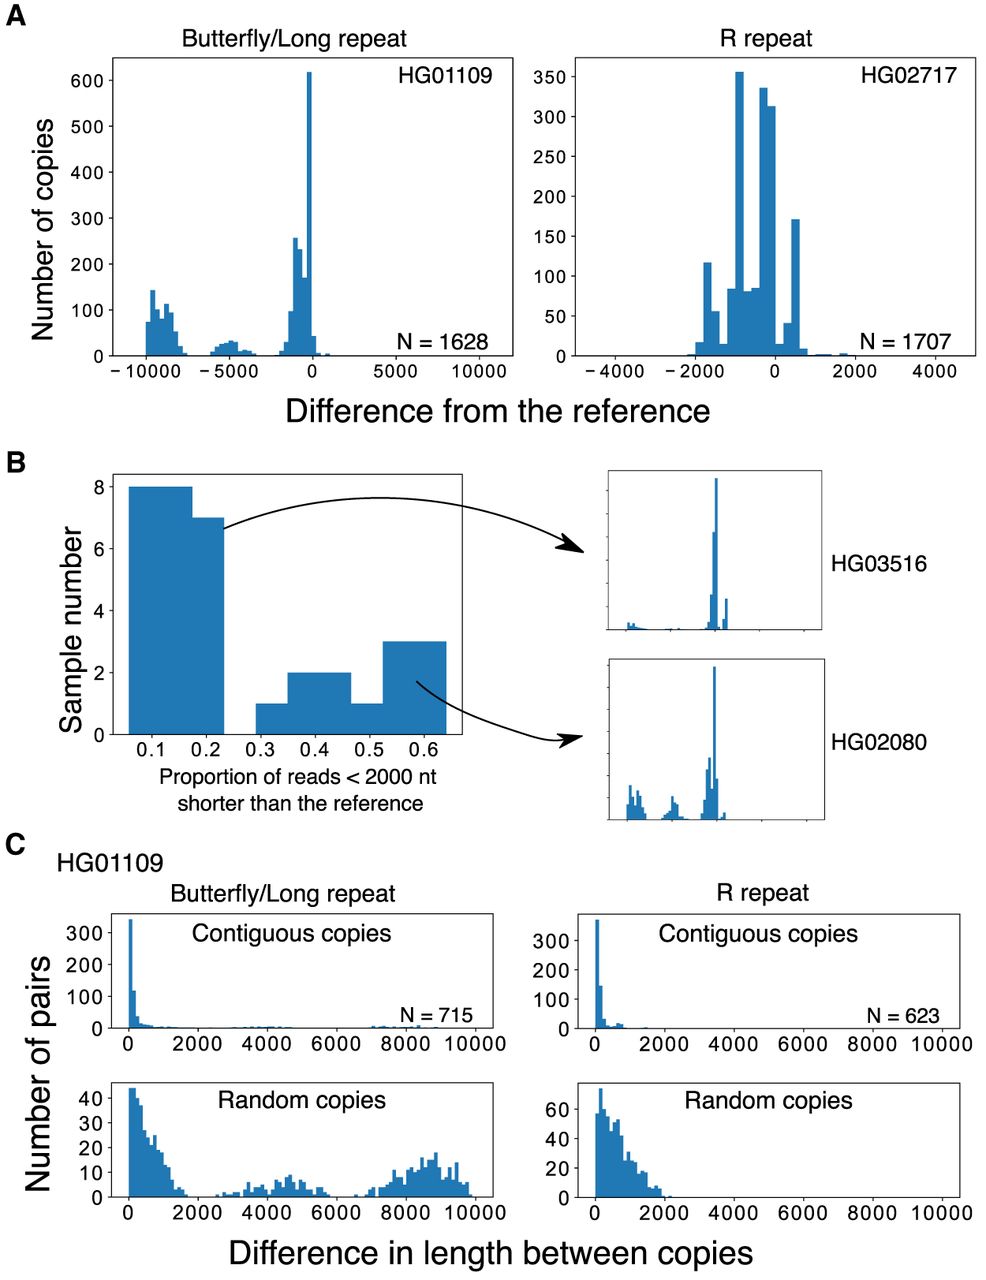
Variations in the IGS region. (A) Length distributions of the variable Butterfly/Long and R repeats of the rDNA IGS in WGS samples. Distributions are plotted based on the difference from the reference (0 indicates the reference length). In these samples, repeat number variations can clearly be seen in the discrete peaks. (B) Plot showing the proportion of reads with a Butterfly/Long repeat length shorter (<2000 nt) than the reference for each sample. The samples can clearly be divided into two categories with each category having a similar pattern of size distribution among individuals (Supplemental Fig. S2). Typical distributions of long (HG03516) and short (HG02080) types are plotted on the right. (C) Differences in the length of contiguous reads calculated for the R and Butterfly/Long repeats (upper panels). As a control, we calculated the differences in the length of the repeats of randomly picked copy pairs (lower panels).


