
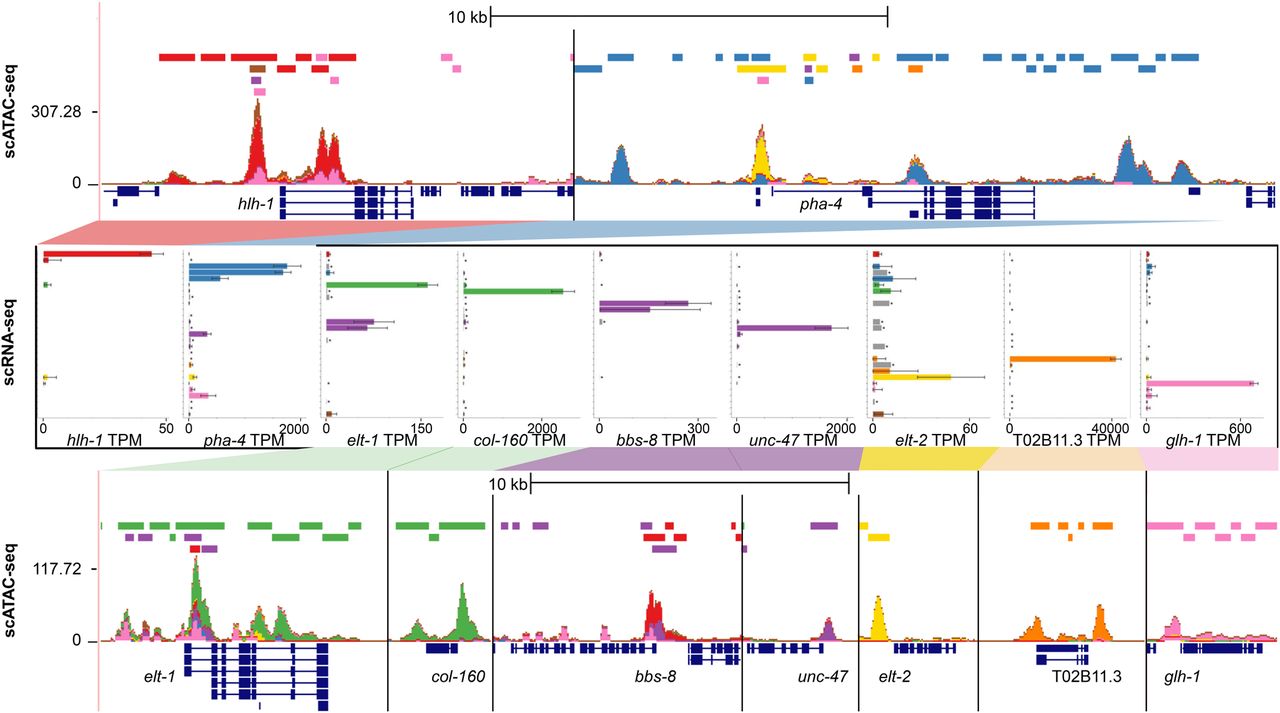
Known tissue-specific genes show topic-specific chromatin accessibility. UCSC Genome Browser multilocus view of the regions surrounding nine known tissue-specific genes (top and bottom), as well as the tissue expression patterns from sci-RNA-seq (middle). In each genome browser view, the top track shows the locations of sci-ATAC-seq peaks colored by tissue type, the second track shows the stacked sci-ATAC-seq signal from each tissue, the third track shows consensus peak regions around local maxima in the signal track, and the fourth track shows the gene models. The gene expression bar plots show expression values for 27 tissues in TPM units, with the same coloring and order as the legend in Figure 5.


