
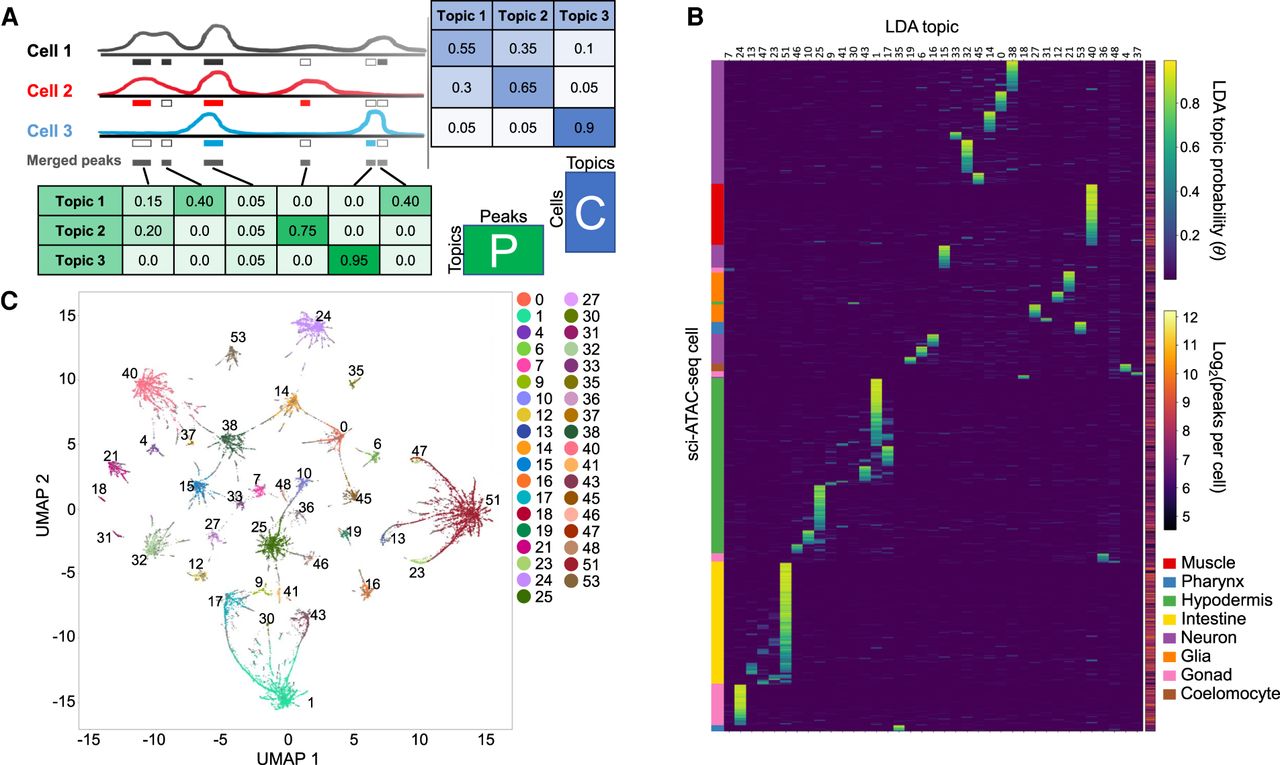
LDA modeling yields 37 major cell clusters that are characterized mostly by a single topic each. (A) LDA modeling learns latent topics that explain the data and return two matrices, here designated P and C. Matrix P, referred to in the text as the peaks-by-topics matrix, captures the probability distribution of each topic over all peaks, whereas matrix C, referred to in the text as the cells-by-topics matrix, captures the probability distribution of each cell over all topics. (B) Heatmap showing the normalized C matrix values for the 37 topics associated with clusters; this plot highlights that most cells have probability concentrated in one or a few topics. Cell types determined for the topics based on analysis of the P matrix are annotated on the left, and the number of peaks per cell is shown to the right. (C) UMAP embedding of the C matrix colored to indicate the 37 cell clusters. Any cells that are not assigned to a cluster are plotted as small gray dots and are mostly found on the periphery of the clusters.


