
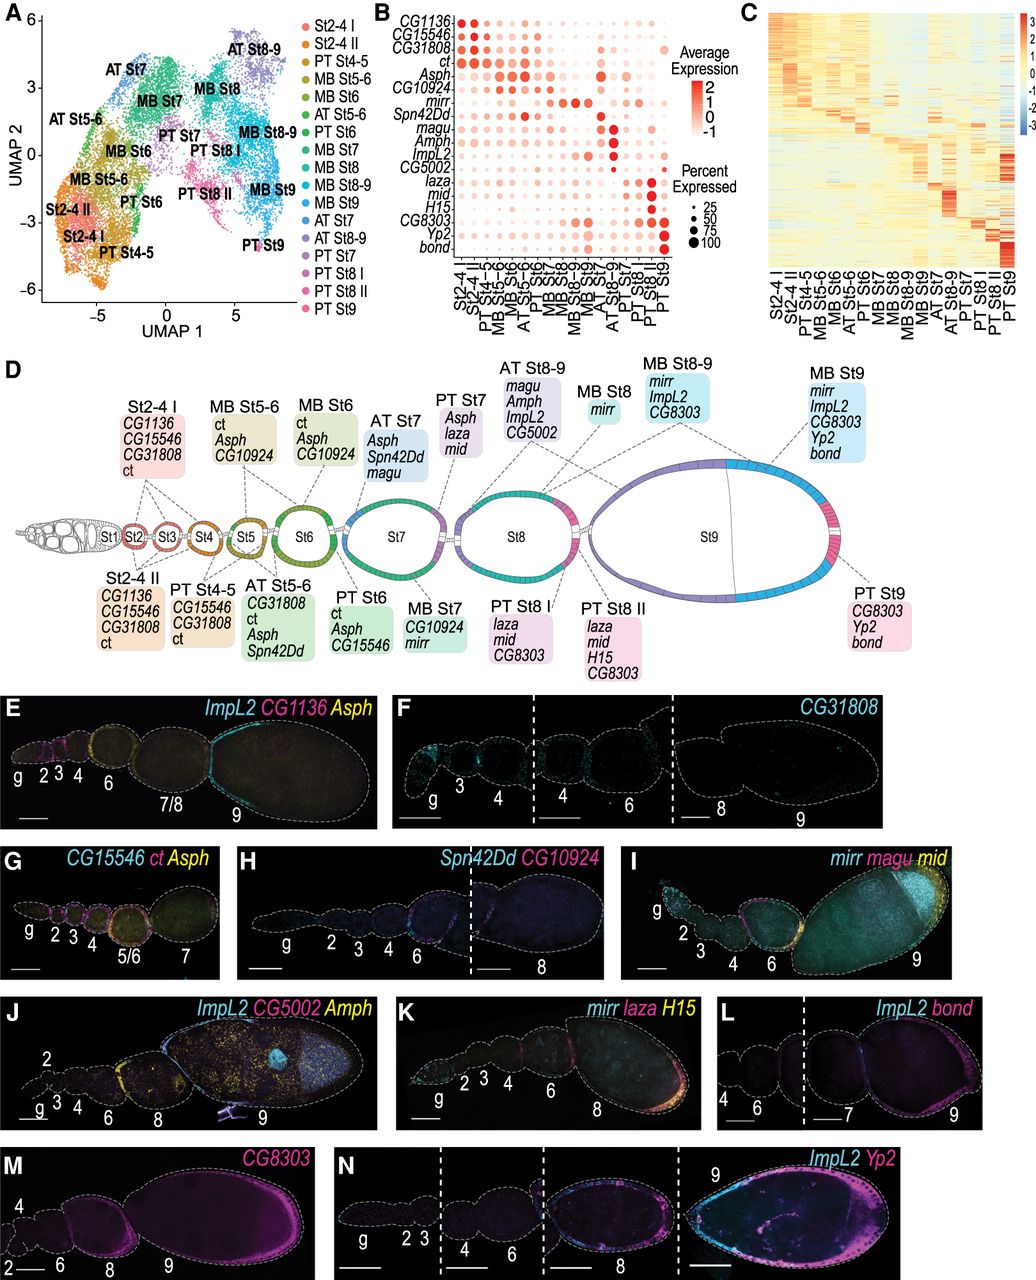
Characterization of 17 FC subpopulations. (A) UMAP plot of FCs subclustered in 17 clusters. Each dot represents a transcriptome of a single cell and is color-coded according to cluster membership. (B) A dot plot visualizing expression of select 18 marker genes. Dot diameter represents the fraction of cells expressing each gene in each cluster, as shown in the scale. Color intensity represents the average normalized expression level. (C) A heat map visualizing average gene expression levels of all FC marker genes in each cluster. Red indicates highest and blue lowest expression. (D) Schematic drawing of an ovariole with FC subtypes highlighted in the colors corresponding to the UMAP plot in A. Note: Contrary to the schematic drawing, in vivo follicles of all stages are not represented equally frequently. (E–N) Marker gene mRNA in situ hybridization using HCR (cyan, magenta, yellow). Follicle stages (2–9) and germarium (g) are indicated above or below each follicle. Scale bars: 30 μm. (E) ImpL2 (cyan) is expressed in stretch cells at stage 9, CG1136 (magenta) is expressed in pre-FCs, and stage 2–4 FCs, Asph (yellow) expressed in stage 6 FCs, and restricted to both termini at stage 7. (F) CG31808 (cyan) is faintly expressed in stage 3–4 FCs and is restricted to ATFCs at stage 6. (G) CG15546 (cyan) has patchy expression in stage 2–4 follicles and is restricted to PTFCs by stage 5–6, ct (magenta) is expressed in all FCs from pre-FC to stage 6, Asph (yellow) expressed in stage 5–6 follicles. (H) Spn42Dd (cyan) is expressed in ATFCs at stage 6, CG10924 (magenta) is expressed in MBFCs at stage 6. (I) mirr (cyan) is expressed in MBFC from stage 6–7 onward, magu (magenta) is expressed in ATFCs from stage 6 and is down-regulated by stage 9, mid (yellow) expressed in PTFCs starting from stage 6. (J) ImpL2 (cyan) is expressed in ATFCs excluding the most anterior tip at stage 8 and in stretch and border cells at stage 9, CG5002 (magenta) is expressed in stretch cells at stage 9, Amph (yellow) expressed in ATFCs at stage 8. (K) mirr (cyan) is expressed in MBFCs from stage 6–7 onward, laza (magenta) is weakly expressed in PTFCs starting from stage 4 and strongly expressed in a broad band of PTFCs at stage 8, H15 (yellow) is expressed in a narrow band of the most posterior PTFCs at stage 8; weak expression is detectable in PTFCs at stage 6. (L) ImpL2 (cyan) is expressed in stretch cells at stage 9, bond (magenta) is expressed in a posterior-to-anterior gradient in PTFCs and MBFCs at stage 9. (M) CG8303 (magenta) is expressed in a posterior-to-anterior gradient in PTFCs and MBFCs at stages 8 and 9. (N) ImpL2 (cyan) is expressed in ATFCs at stage 8, extending into MBFCs, and in stretched cells at stage 9, Yp2 (magenta) is expressed in a posterior-to-anterior gradient in PTFCs and MBFCs at stages 8 and 9. Its expression is excluded from the most posterior tip.


