
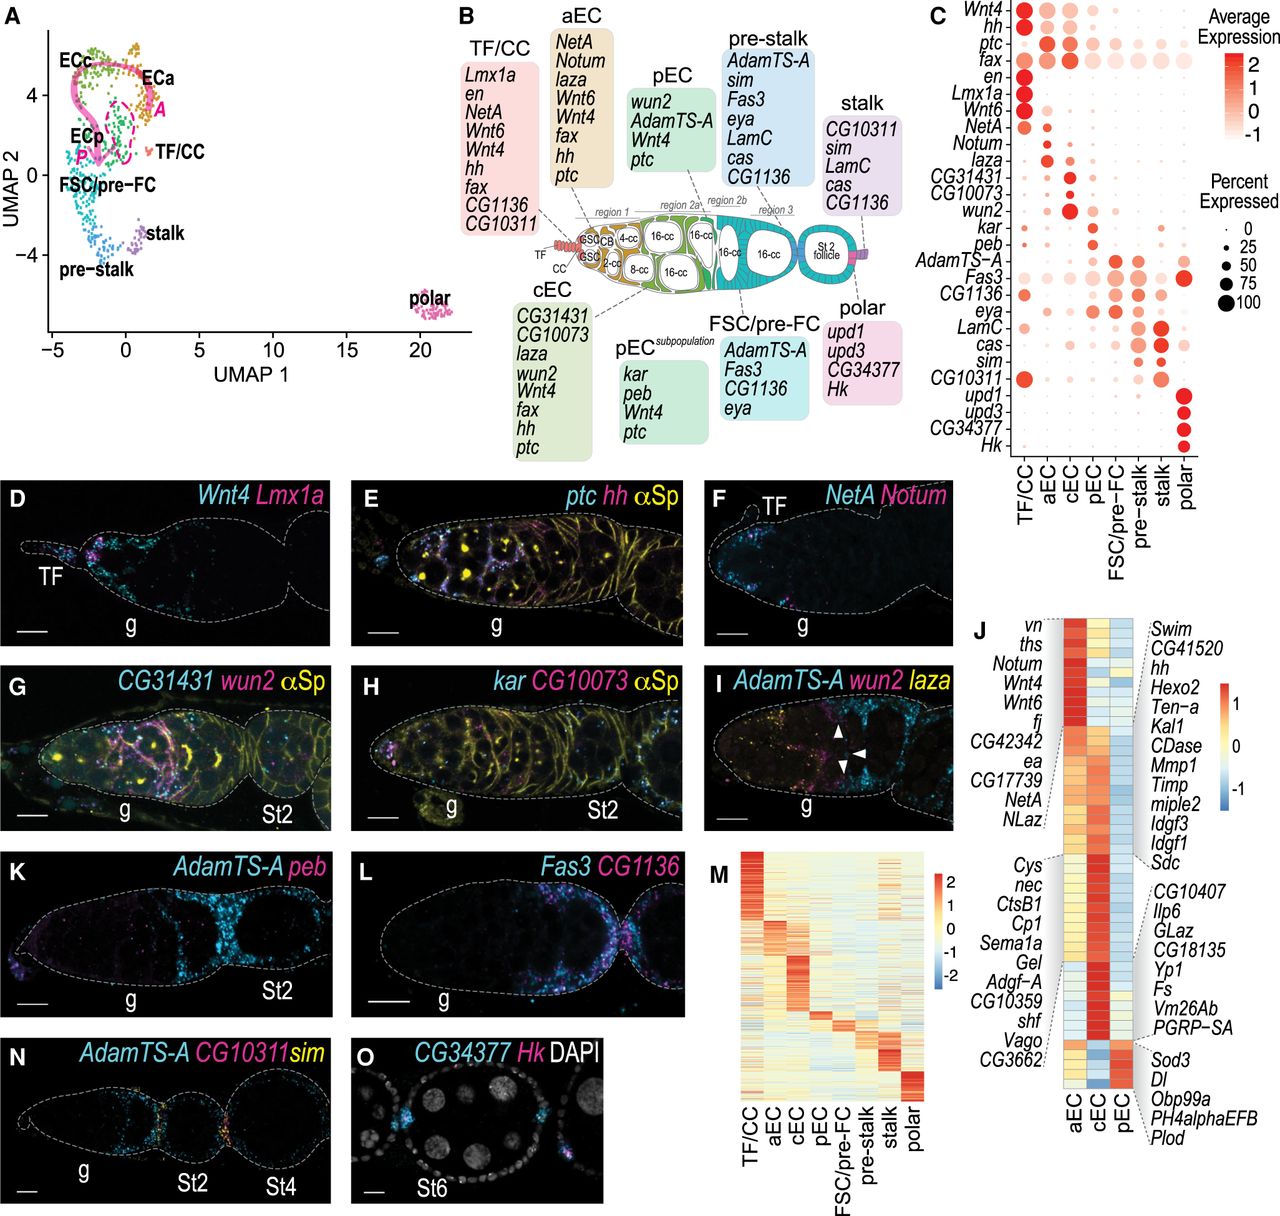
Identification of three transcriptionally distinct EC subtypes. (A) UMAP plot of somatic cells of the germarium subclustered in eight clusters. Each dot represents a transcriptome of a single cell and is color-coded according to cluster membership. (B) Schematic drawing of a germarium and stage 2 follicle with somatic cells highlighted in the colors corresponding to the UMAP plot in A. GCs are colored in white, and their differentiation stages (GSC, CB, and cyst stage) are indicated in each cell. Germarium regions are indicated above the cartoon. Color-coded boxes indicate select marker genes for each cluster. Note: Contrary to the schematic drawing, in vivo germ cell differentiation stages are not represented equally frequently. (C) A dot plot visualizing expression of select 28 marker genes. Dot diameter represents the fraction of cells expressing each gene in each cluster, as shown in the scale. Color intensity represents the average normalized expression level. (D–I,K,L,N,O) Marker gene mRNA in situ hybridization using HCR (cyan, magenta, and yellow). Scale bars: 10 μm. (g) Germaria, (TF) terminal filament, (St2, St4, St6) oogenesis stages for follicles. (E,G,H) Spectrosomes, fusomes, and somatic cell membranes are labeled by anti-α-Spectrin (yellow). (D) Wnt4 (cyan) is expressed in TF, CC, and ECs, Lmx1a (magenta) is expressed in TF and CC. (E) ptc (cyan) is expressed in ECs, hh (magenta) is expressed in ECs and pre-FCs. (F) NetA (cyan) and Notum (magenta) are expressed in anterior ECs in germarium region 1. (G) CG31431 (cyan) is predominantly expressed in ECs in germarium region 2a with some expression in region 1 and 2b, wun2 (magenta) is predominantly expressed in ECs in germarium region 2a. (H) kar (cyan) is sparsely and lowly expressed throughout the germarium, CG10073 (magenta) is predominantly expressed in region 2a ECs. (I) AdamTS-A (cyan) is expressed in FSCs, pre-FCs, and the most posterior ECs, wun2 (magenta) is predominantly expressed in ECs in germarium region 2a, laza (yellow) is expressed in anterior ECs in germarium region 1 and some ECs in germarium region 2a. (J) A heat map visualizing average expression levels of EC enriched secreted proteins and ECM components. Red indicates highest and blue lowest expression. (K) AdamTS-A (cyan) is expressed in FSCs, pre-FCs, and the most posterior ECs, peb (magenta) is sparsely and lowly expressed throughout the germarium. (L) Fas3 (cyan) and CG1136 (magenta) are expressed in FC lineage including FSCs, pre-FCs, prestalk, and epithelial FCs. (M) A heat map visualizing average gene expression levels of all somatic cell marker genes in each cluster. Red indicates highest and blue lowest expression. (N) AdamTS-A (cyan) is expressed in FC lineage including FSCs, pre-FCs, prestalk, and epithelial FCs, CG10311 (magenta) is expressed in stalk cells, sim (yellow) expressed in prestalk and stalk cells. (O) CG34377 (cyan) and Hk (magenta) are expressed in polar cells, DAPI (white) labels cell nuclei.


