
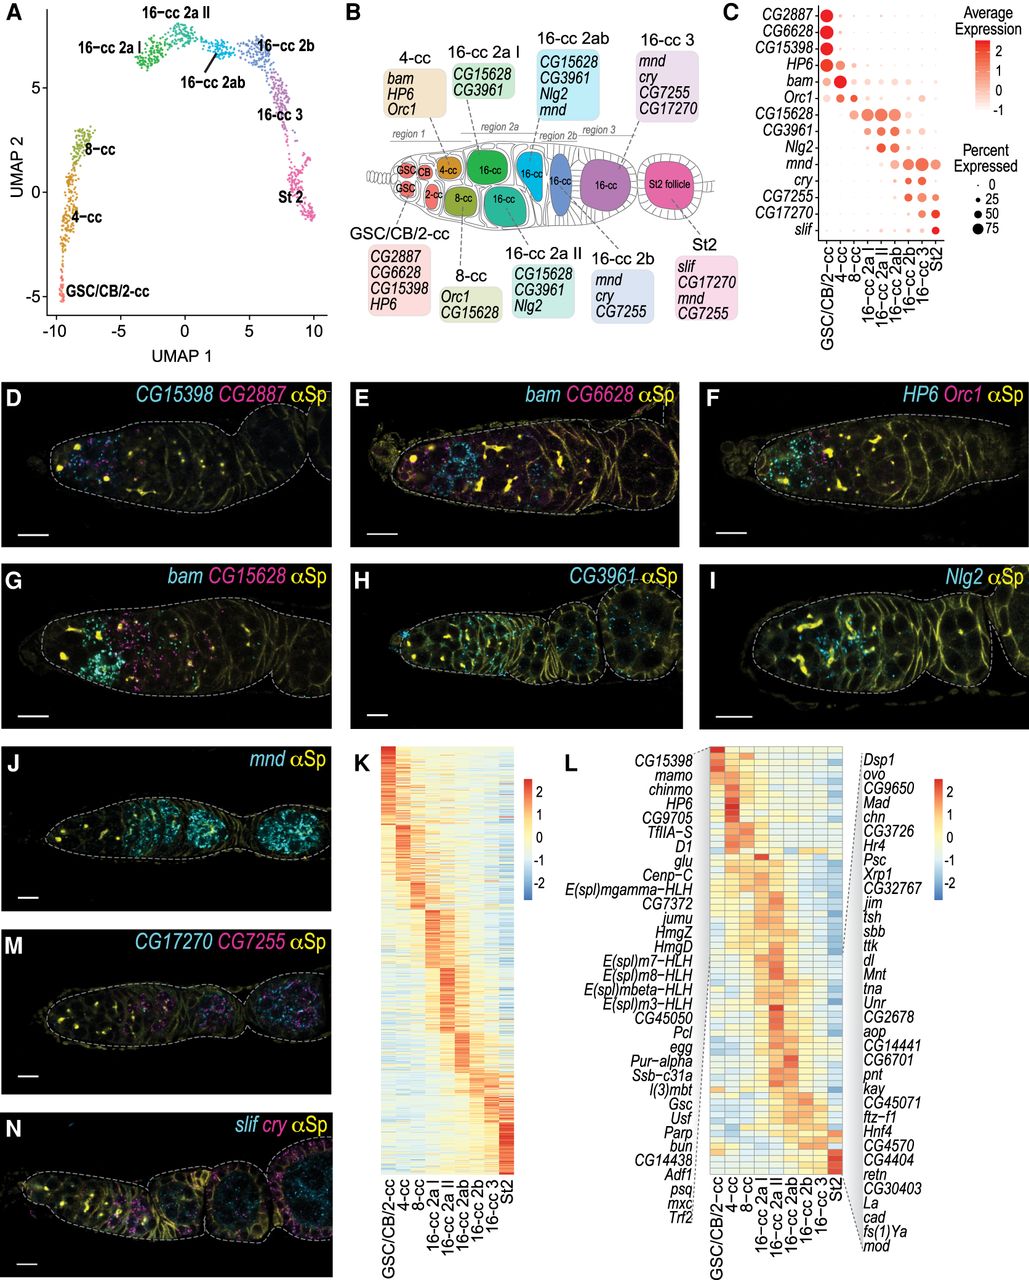
GC subclustering in nine differentiation states. (A) UMAP plot of GCs subclustered in nine differentiation states. Each dot represents a transcriptome of a single cell and is color-coded according to cluster membership. (B) Schematic drawing of a germarium and stage 2 follicle with GCs highlighted in the colors corresponding to the UMAP plot in A. Germ cell differentiation stages (GSC, CB, and cyst stage) are indicated in each cell. TFs, CCs, ECs, and FC lineages are colored in white. Germarium regions are indicated above the cartoon. Color-coded boxes indicate select marker genes for each cluster, whose mRNAs are visualized in D–J, M, and N. Note: Contrary to the schematic drawing, in vivo germ cell differentiation stages are not represented equally frequently. (C) A dot plot visualizing expression of 14 marker genes in nine GC clusters. Dot diameter represents the fraction of cells expressing each gene in each cluster, as shown in scale. Color intensity represents the average normalized expression level. (D–J,M,N) Marker gene mRNA in situ hybridization using HCR (cyan, magenta). Spectrosomes, fusomes, and somatic cell membranes are labeled by anti-α-Spectrin (yellow). Scale bars: 10 μm. (D) CG15398 (cyan) and CG2887 (magenta) are expressed in GSCs, CBs, and two-cell cysts. (E) bam (cyan) is predominantly expressed in four-cell cysts, CG6628 (magenta) is expressed in GSCs, CBs, and two-cell cysts. (F) HP6 (cyan) is expressed in GSCs, CBs, two-cell and four-cell cysts, Orc1 (magenta) is expressed in four-cell and eight-cell cysts. (G) bam (cyan) is predominantly expressed in four-cell cysts, with lower expression in two-cell and later stage cysts, CG15628 (magenta) is expressed in eight-cell and 16-cell cysts in germarium regions 2a and 2b. (H) CG3961 (cyan) is expressed predominantly in 16-cell cysts in germarium regions 2a and 2b. (I) Nlg2 (cyan) is expressed in 16-cell cysts in germarium regions 2a and 2b. (J) mnd (cyan) is expressed in 16-cell cysts in germarium regions 2a, 2b and 3, and in stage 2 follicles. (K,L) Heat maps visualizing average gene expression levels of all GC marker genes (K) and dynamically expressed transcription factors (L) in each cluster. Red indicates highest and blue lowest expression. (M) CG17270 (cyan) is expressed in 16-cell cysts in germarium region 3 and in stage 2 follicle, CG7225 (magenta) is expressed in 16-cell cysts in germarium regions 2b and 3, in stage 2 follicle and beyond. (N) slif (cyan) is expressed in stage 2 follicle and beyond, cry (magenta) is expressed in 16-cell cysts in germarium regions 2b and 3 and in follicle cells.


