
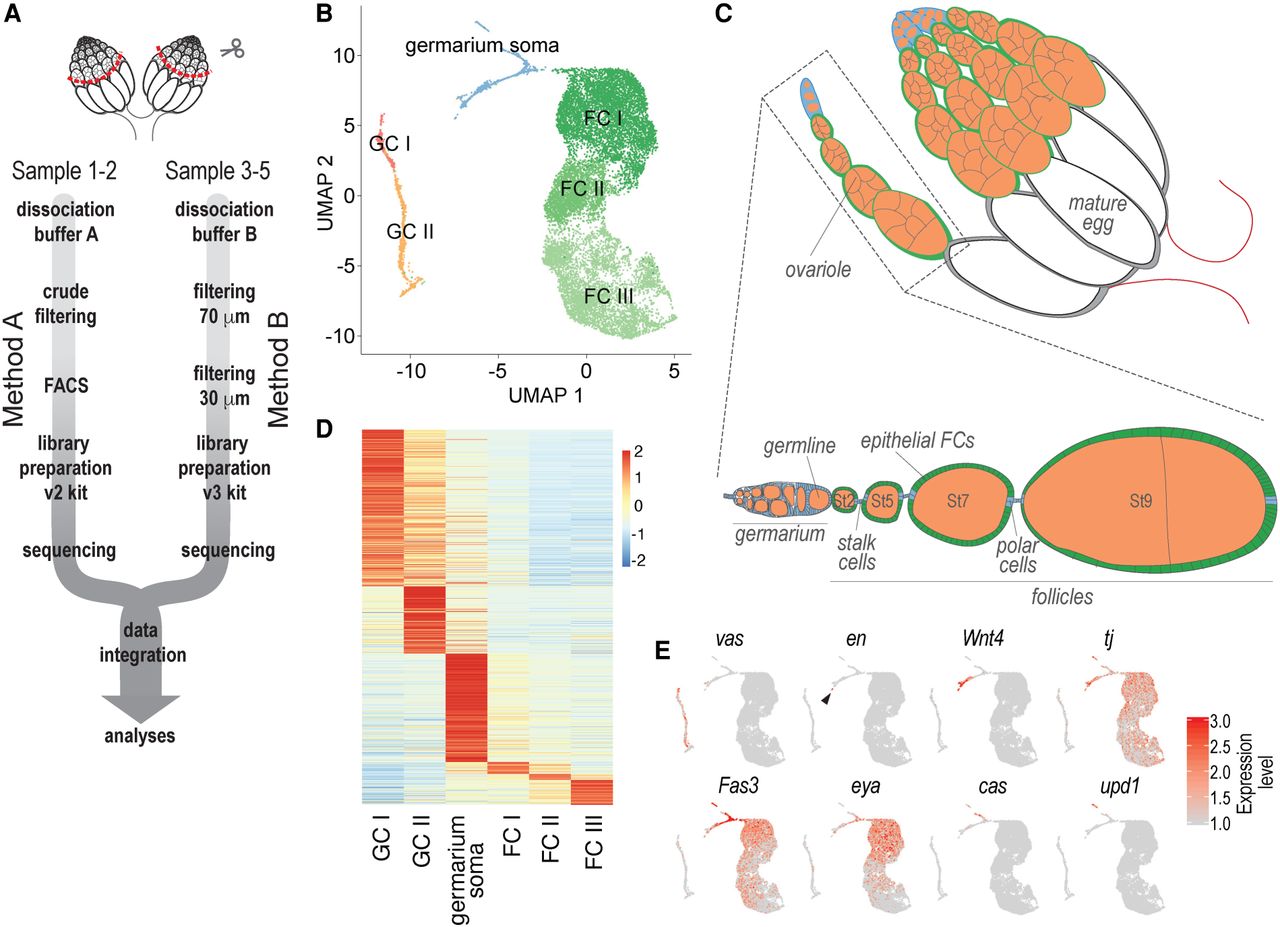
Figure 1.
scRNA-seq of Drosophila adult ovaries. (A) Schematic of the scRNA-seq sample preparation. (B) UMAP plot of the entire data set. Each dot represents a transcriptome of a single cell and is color-coded according to cluster membership. (C) Schematic drawing of an adult ovary. (D) A heat map visualizing average gene expression levels of all marker genes in each cluster. Red indicates highest and blue lowest expression. (E) Expression of major cell type markers vas, en, Wnt4, tj, Fas3, eya, cas, and upd1. Red indicates highest and light gray lowest expression. Arrowhead indicates en-expressing cells.


