
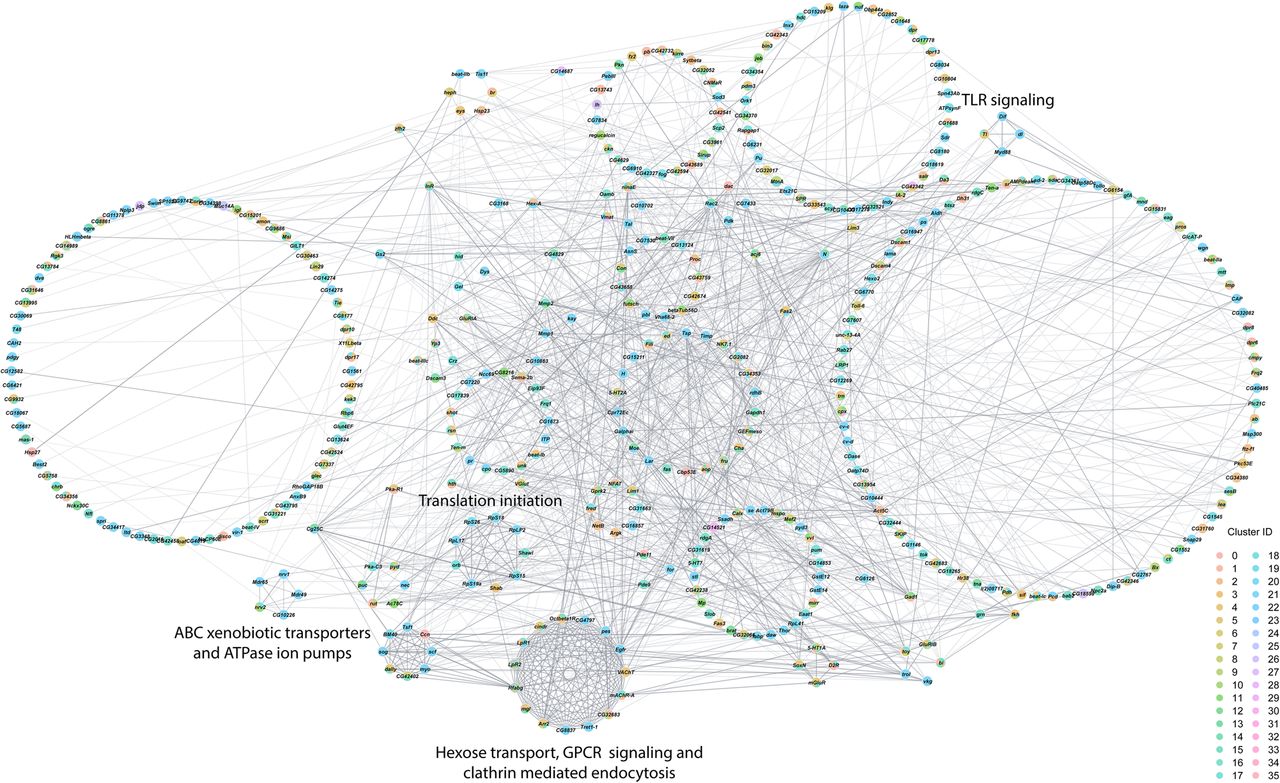
Interaction network analysis of DEGs from all clusters in the male data set. Network constructed from interactions calculated using StringApp plugin within Cytoscape for genes that were differentially expressed (filtered for |logeFC| > 0.1 and Bonferroni-adjusted P-value < 0.05) in all clusters from the male data set. Gray edges represent interactions. Genes that were differentially expressed in multiple clusters are depicted as pie charts with each color representing the respective cluster. Genes are grouped into circles based on their MCODE connectivity scores. Annotations of these circular groups represent the pathways that are enriched for the genes within these groups. Bonferroni-adjusted P-value < 0.05 was considered as significant for enrichment in the statistical overrepresentation tests.


