
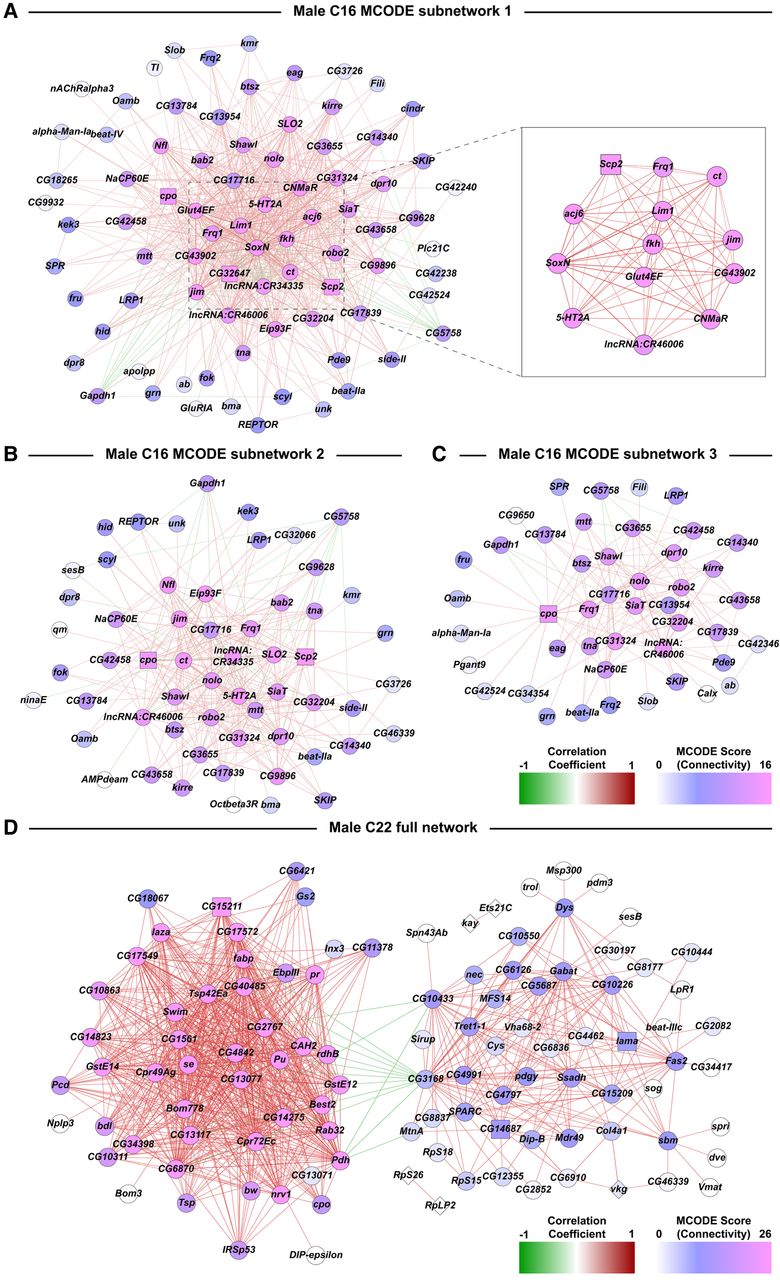
Subnetworks from coexpression network analyses of DEGs from the male C16 and C22 clusters. Networks are constructed from Pearson coefficient-based coexpression values calculated from scaled data of genes that were differentially expressed (filtered for |logeFC| > 0.5, Bonferroni-adjusted P-value < 0.05) due to cocaine exposure. Coexpressions have been filtered using Random Matrix Theory. (A–C) MCODE subnetworks derived from the full network of male cluster C16. The inset in A corresponds to a subset of genes within the subnetwork that have very strong correlation coefficient values with each other compared to the rest of the data set. Colors of the dots represent the connectivity index derived from MCODE scores. Colors of edges represent the positive (red) and negative (green) correlations. (D) Coexpression network analysis of DEGs from the male C22 cluster.


