
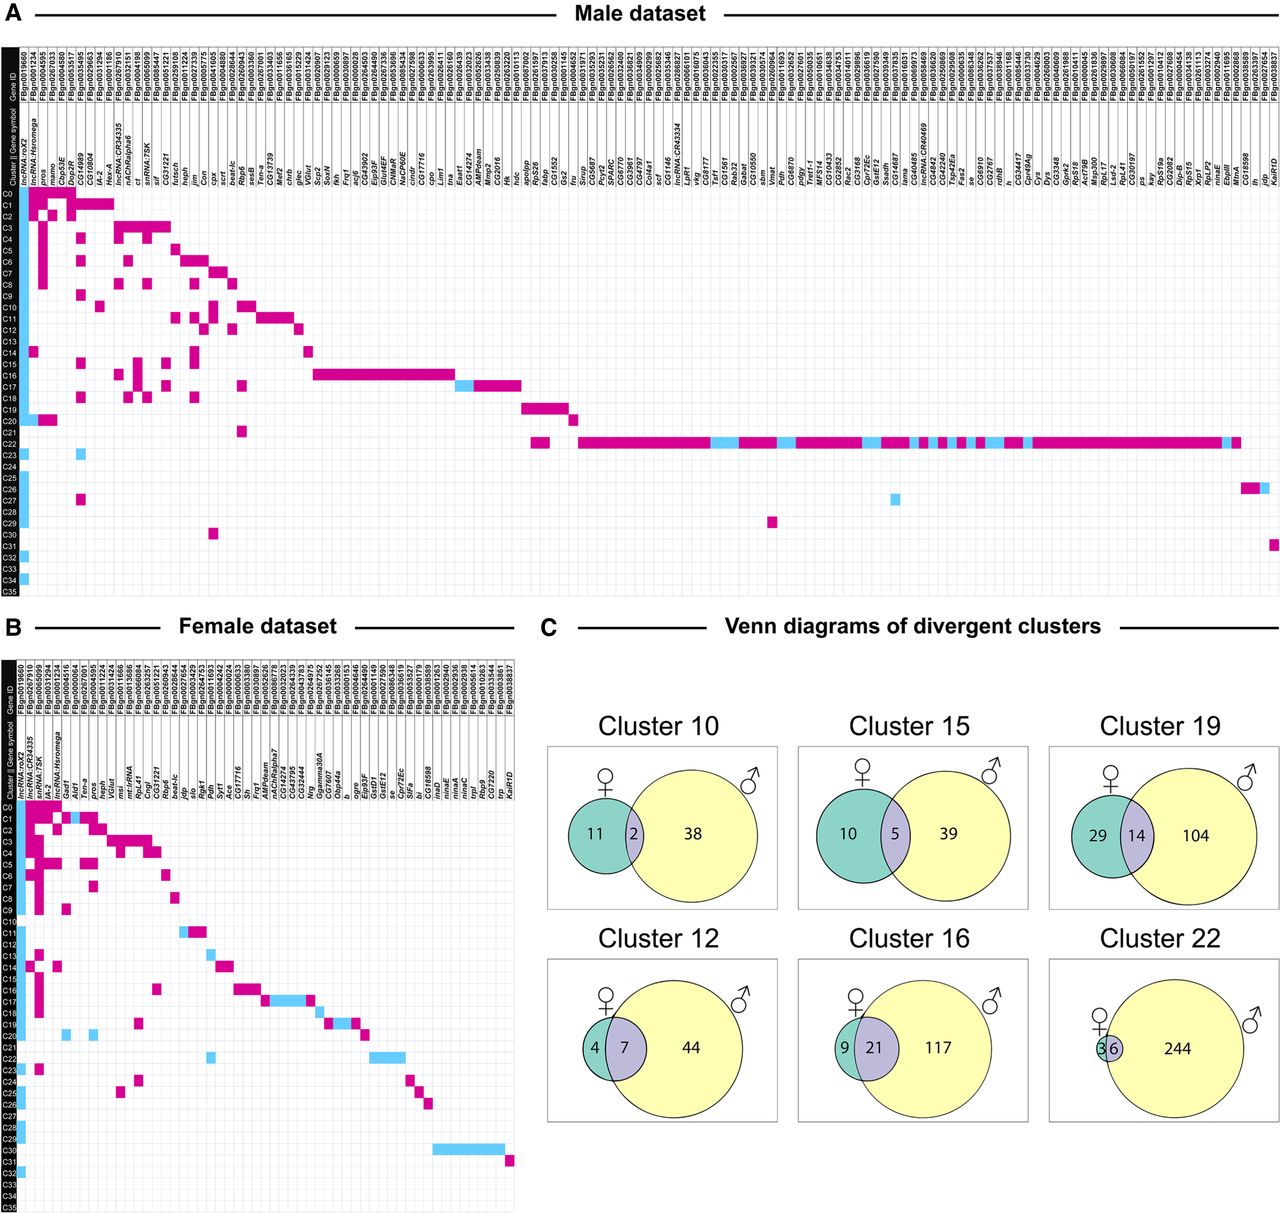
Distribution of differentially expressed genes across clusters in males (A) and females (B) exposed to cocaine, and Venn diagrams showing overlap between differentially expressed genes in males and females (C). To identify clusters with unique gene expression patterns following acute exposure to cocaine, we filtered the list of differentially expressed genes to only show the strongest responses (|logeFC| > 1.0, Bonferroni-adjusted P-value < 0.05) to construct an expression matrix. Differentially expressed genes are listed on the top (columns) and cell clusters are represented by the rows. Magenta boxes show up-regulation and turquoise boxes show down-regulation of gene expression as a result of exposure to cocaine. Panel C shows Venn diagrams of clusters with sexually dimorphic responses to cocaine exposure. The numbers within each Venn diagram represent the unique and shared differentially expressed (|logeFC| > 0.5, Bonferroni-adjusted P-value < 0.05) genes due to cocaine exposure from DGE analysis performed for the corresponding cluster in male and female data sets separately.


