
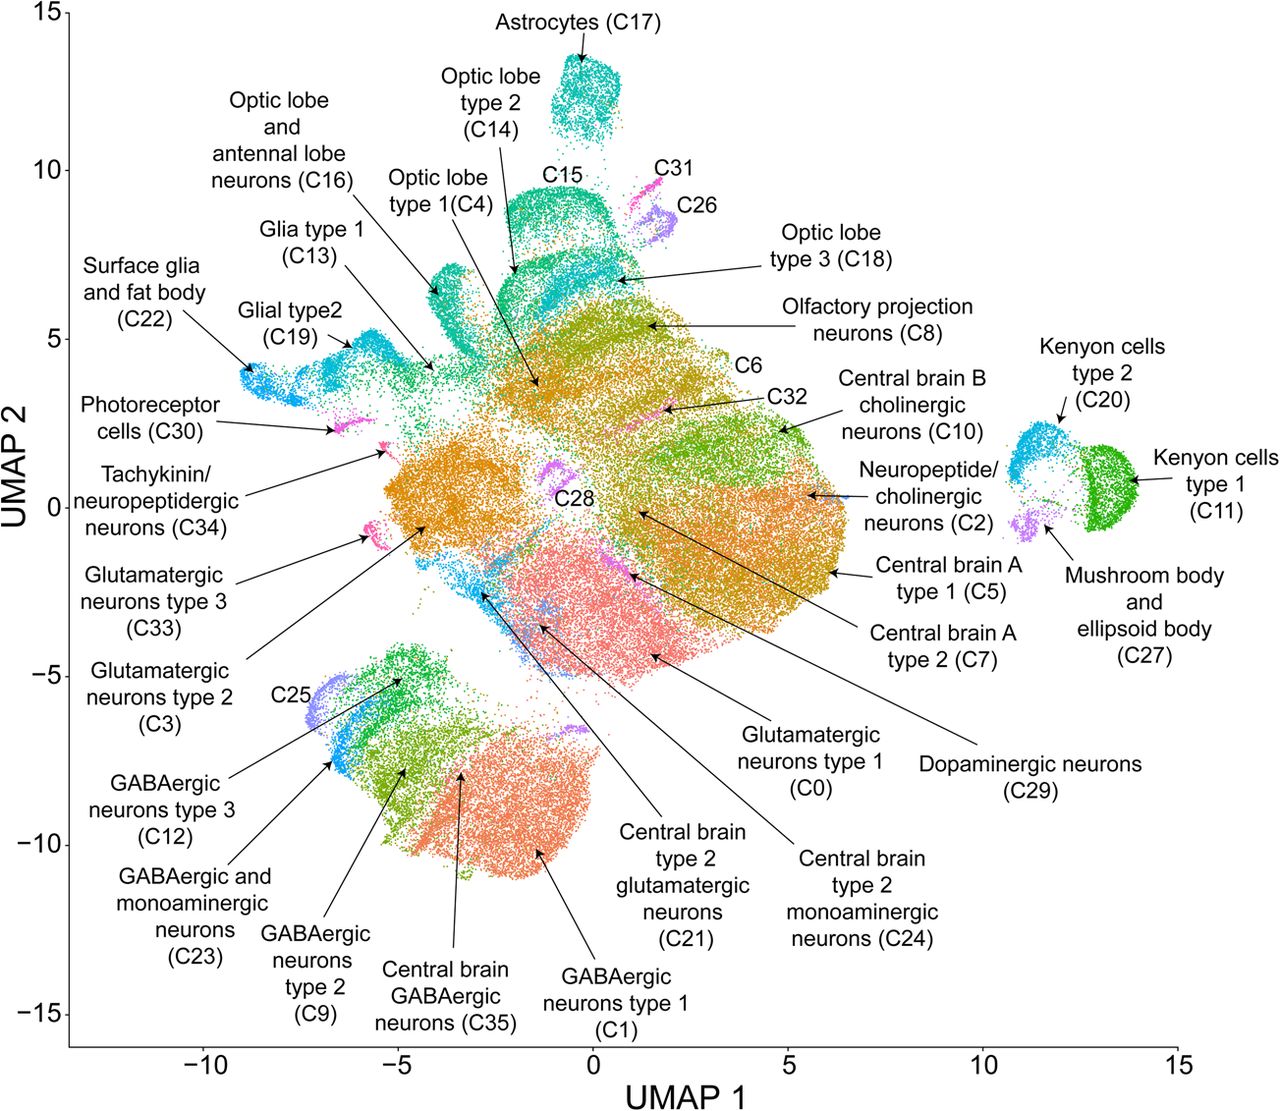
Figure 2.
UMAP visualization and clustering of single-cell expression data. Cells were clustered based on their expression pattern using the unsupervised shared nearest neighbor (SNN) clustering algorithm. Individual dots represent each cell and the colors of the dots represent the cluster to which the cells belong. Identification of cell types from clusters was performed by cross-referencing cluster-defining genes across FlyBase (Thurmond et al. 2019) and published literature (see Supplemental Table S4).


