
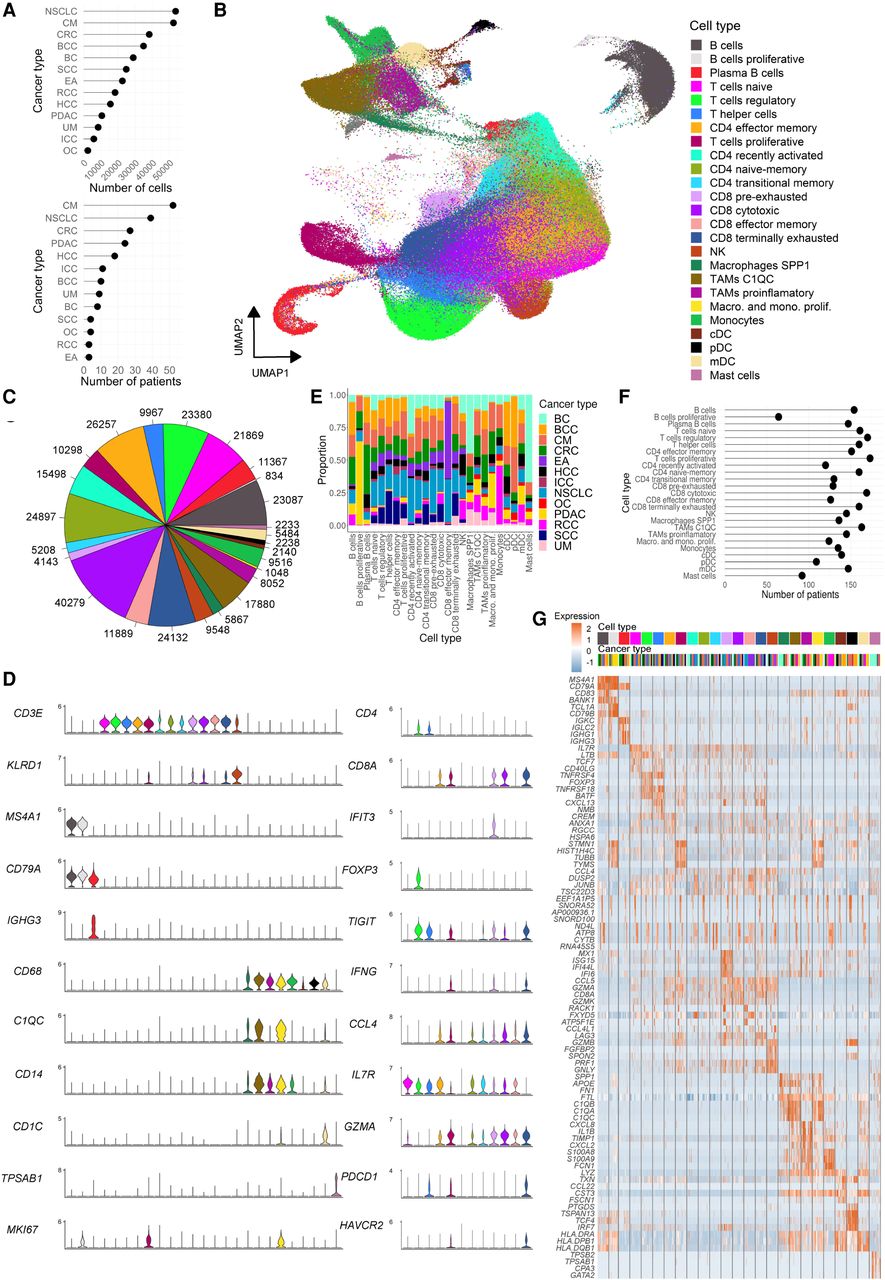
Figure 1.
Characterization of the tumor immune cell atlas. (A) Number of cells (top) and patients (bottom) per cancer type included in the atlas. (B) UMAP of 317,111 immune cells from 13 cancer types colored by annotated cell type. (C) Total number of cells of each immune cell type/state; color code as in A. (D) Marker gene expression levels for broader cell types (left) and only T cells states (right); color code as in A. (E) Cancer type proportions for each annotated cell type/state. (F) Number of unique patients representing each cell type/state in the atlas. (G) Expression of the top four differentially expressed genes per cell type/state; colored by cell type (as in A) and cancer type (as in E).


