
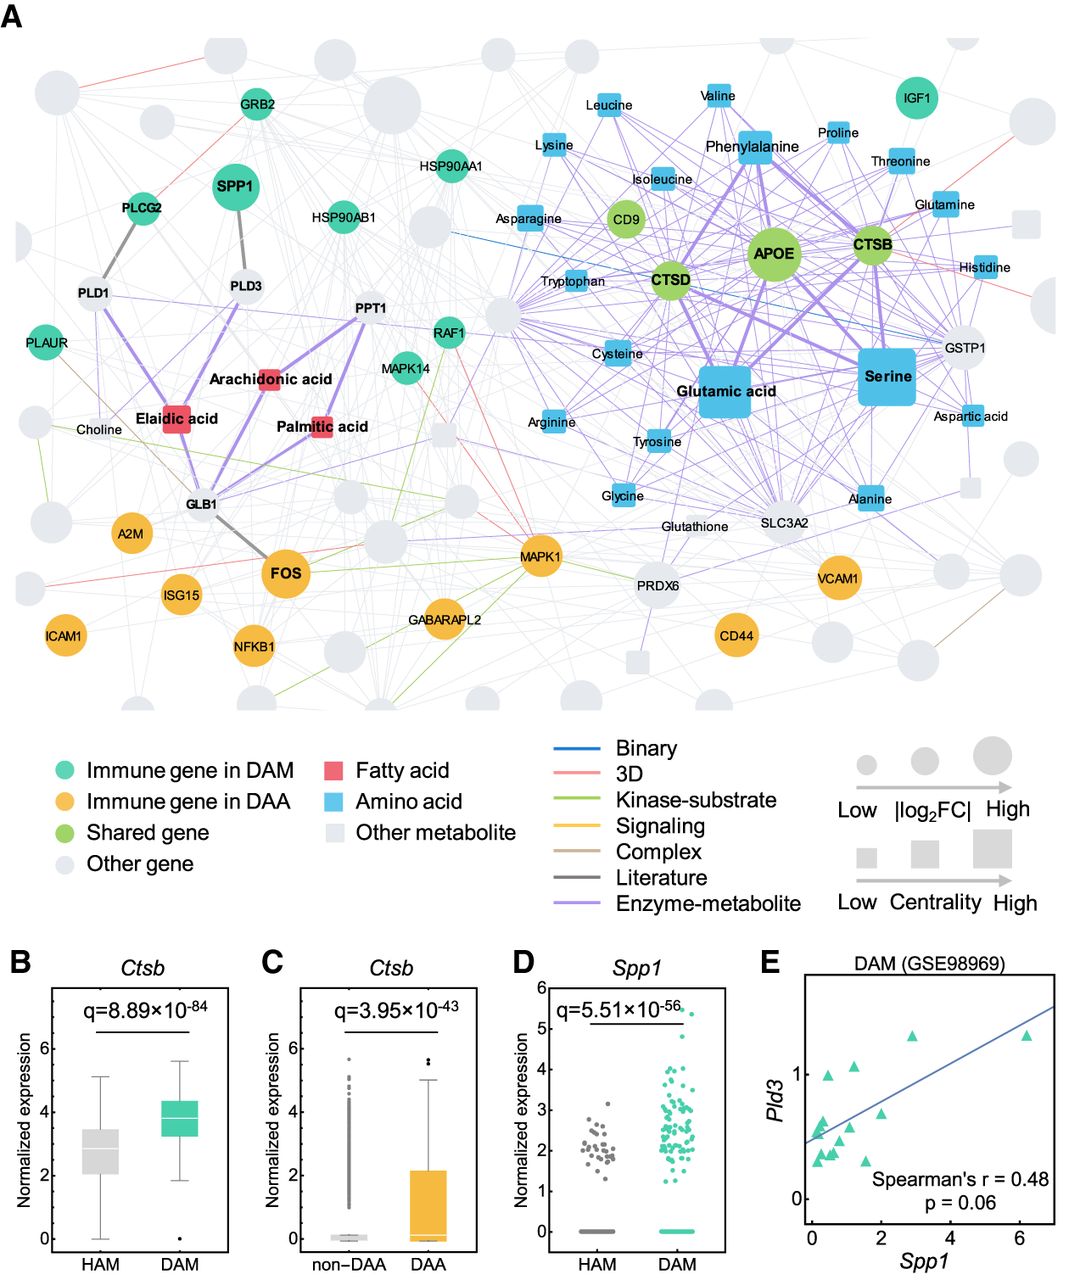
A metabolite-triggered molecular network between DAA and microglia (DAM). (A) A highlighted subnetwork of the metabolite-enzyme network between DAM and DAA in the human protein–protein interactome network model. (FC) Fold-change. (B,C) Expression of Ctsb is significantly elevated in DAM (GSE98969) (B) and DAA (GSE143758) (C) compared to homeostatic associated microglia (HAM) and non-DAA, respectively. (D) Expression of Spp1 is significantly elevated in DAM (GSE98969) compared with HAM. Each dot represents one cell/nucleus. (E) Spearman's correlation analysis shows that Spp1 and Pld3 have a slight coordinated change trends in DAM. Gene expression is counted by the average unique molecular identifier (UMI) count.


