
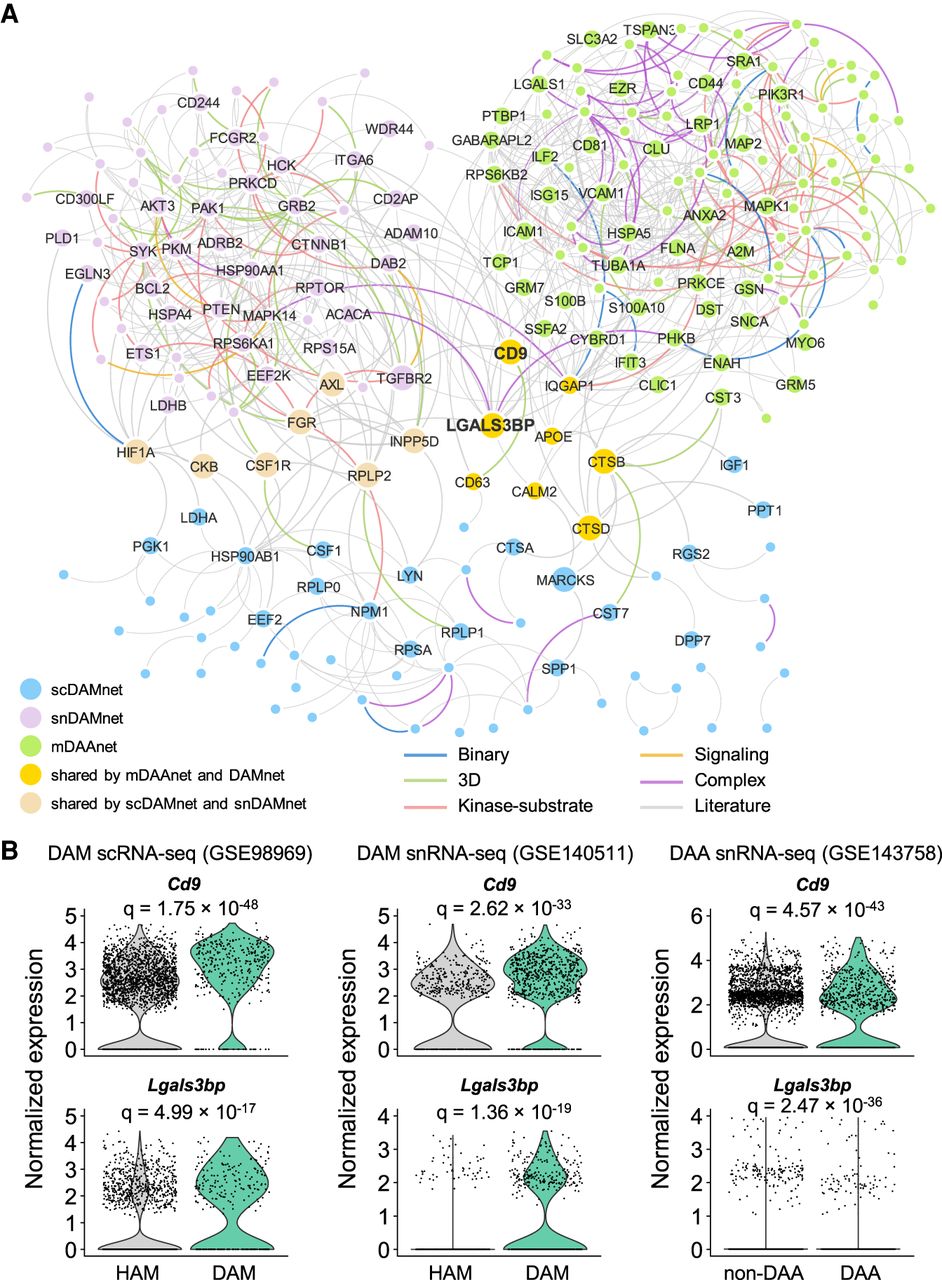
Figure 5.
Comparison of molecular networks between DAA and microglia (DAM). (A) Visualization of interplays between DAM and DAA molecular networks in the human protein–protein interactome network model. (B) Expression levels of Lgals3bp and Cd9 for homeostatic associated microglia (HAM) versus DAM and non-DAA versus DAA. The adjusted P-value (q) is computed using the MAST R package (Supplemental Material). All details for gene differential expression analyses are provided in Supplemental Tables S4, S5, and S7.


