
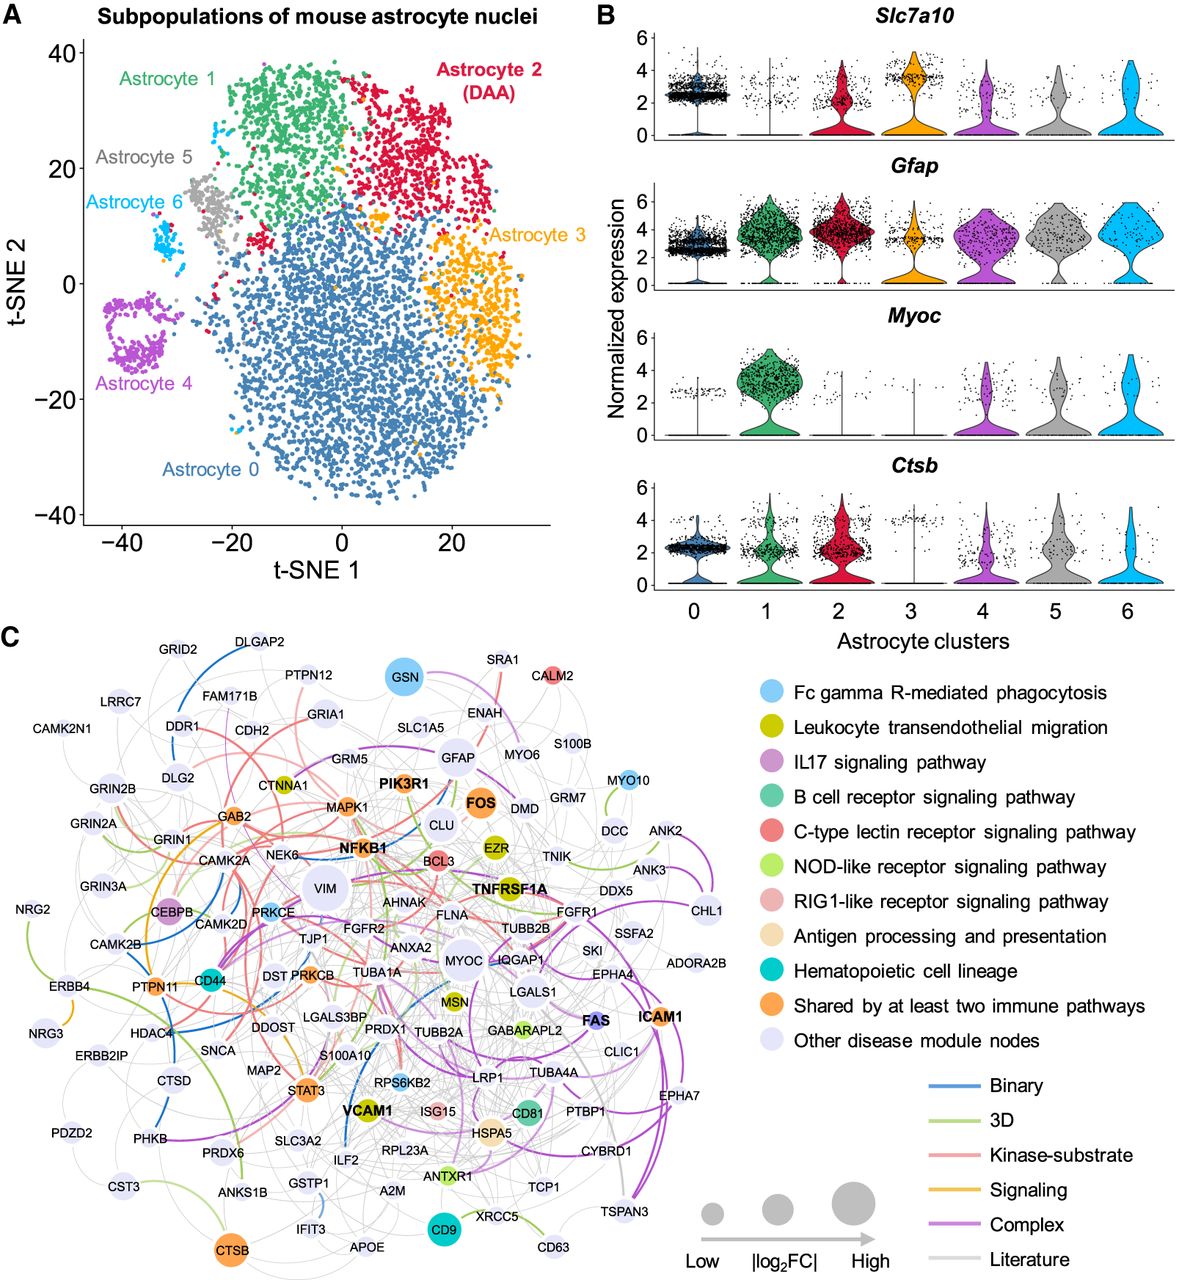
Discovery of DAA-specific molecular networks in transgenic mouse model of AD. (A) T-distributed stochastic neighbor embedding (t-SNE) plot of clustering 7748 astrocyte nuclei. Red cluster denotes the DAA. (B) Stacked violin plot displaying the expression patterns of four representative genes (with the remaining nine genes in Supplemental Fig. S4A) across different astrocyte subclusters. (C) A predicted DAA-specific molecular network contains 407 protein–protein interactions (PPIs) connecting 116 gene products (proteins). Node sizes are proportional to their corresponding |log2FC| during differential expression analysis. Node color is coded by known immune pathways from the Kyoto Encyclopedia of Genes and Genomes (KEGG) database. Edge color is coded by experimental evidences of PPIs. Key immune modulators related to AD are highlighted by bold text.


