
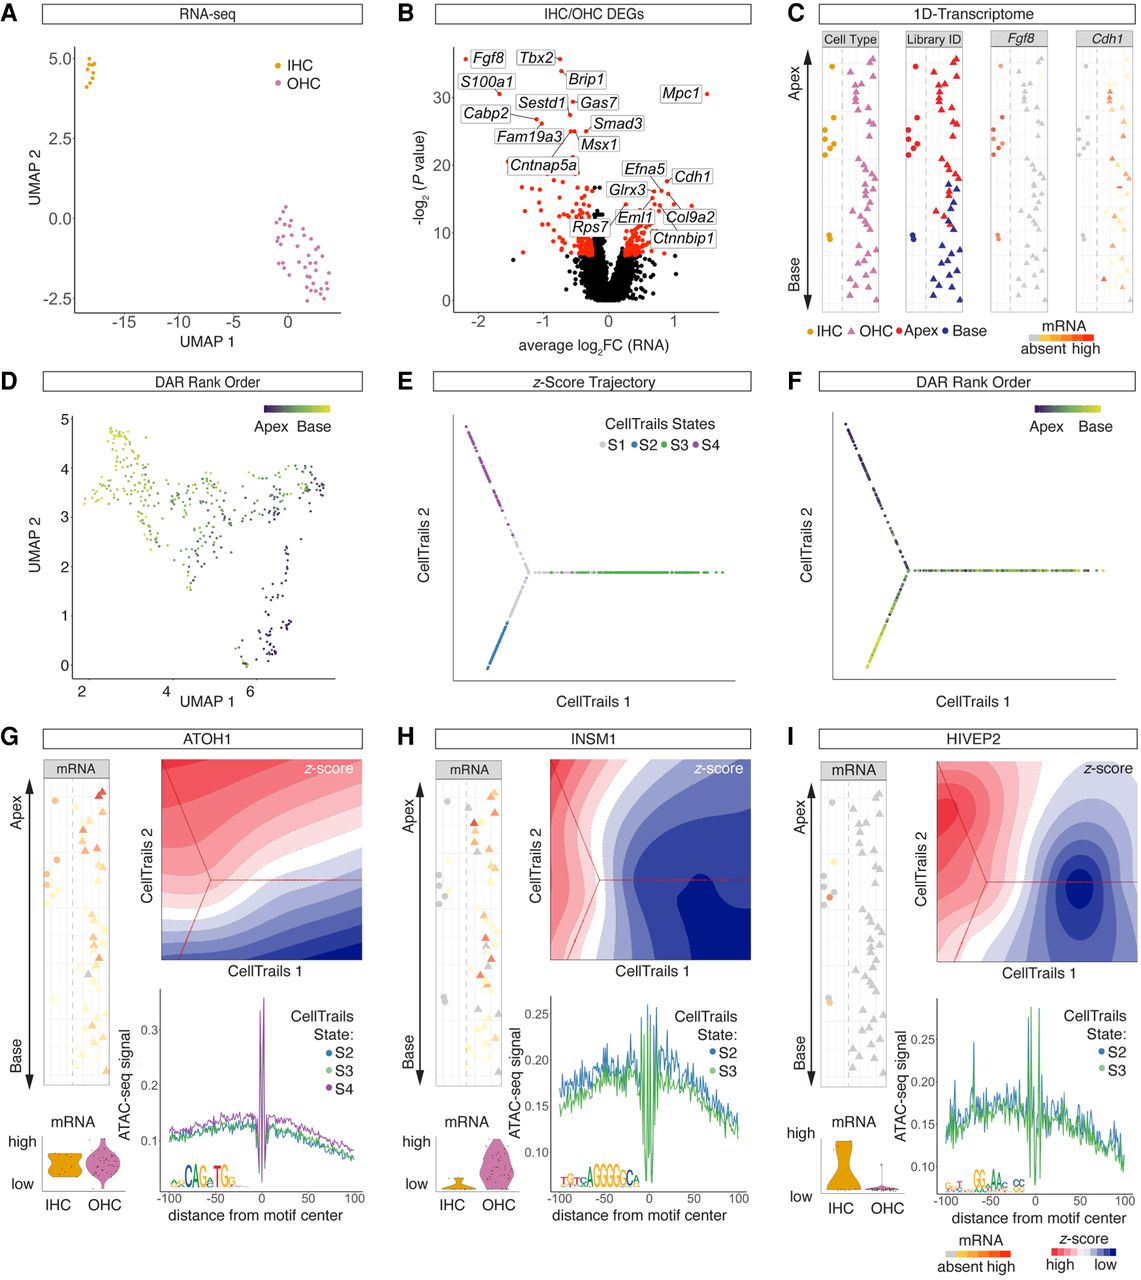
Developmental bifurcation of IHCs and OHCs. (A) UMAP projection of scRNA-seq HCs delineates IHCs and OHCs subclusters. A single dot represents a single cell. (B) Volcano plot of DEGs (P < 0.01) between IHC and OHC clusters. (C) 1D spatial reconstruction map with cell identity (first column) and library ID (second column) projected. Expression levels of IHC-specific gene Fgf8 (third column) and OHC-specific gene Cdh1 (fourth column) were projected onto the 1D spatial reconstruction map. Dashed line delineates IHCs (left) from OHCs (right). (D) UMAP plot of HC cluster from scATAC-seq data with projection of spatial rank order as determined by 1D spatial reconstruction map. (E,F) Trajectory reconstruction based on scATAC-seq z-scores using CellTrails. CellTrails states (E) and DAR-based rank order (F) projected onto the trajectory. (G,I) Comparative analysis of selected TFs in terms of mRNA expression, motif accessibility, and footprints. (G, top left column) Atoh1 mRNA expression projected onto the 1D spatial reconstruction map. Dashed line delineates IHCs (left) from OHCs (right). (Bottom left column) Violin plots with mRNA levels for IHCs and OHCs. (Top right column) Contour plot of ATOH1 z-scores with CellTrails trajectory in the background. (Bottom right column) ATOH1 footprint from scATAC-seq data for selected CellTrails states (same color code as in E). ATOH1 consensus sequence is depicted at the bottom left of the footprint plot. (H,I) Analogous data representation for INSM1 (H) and HIVEP2 (I).


