
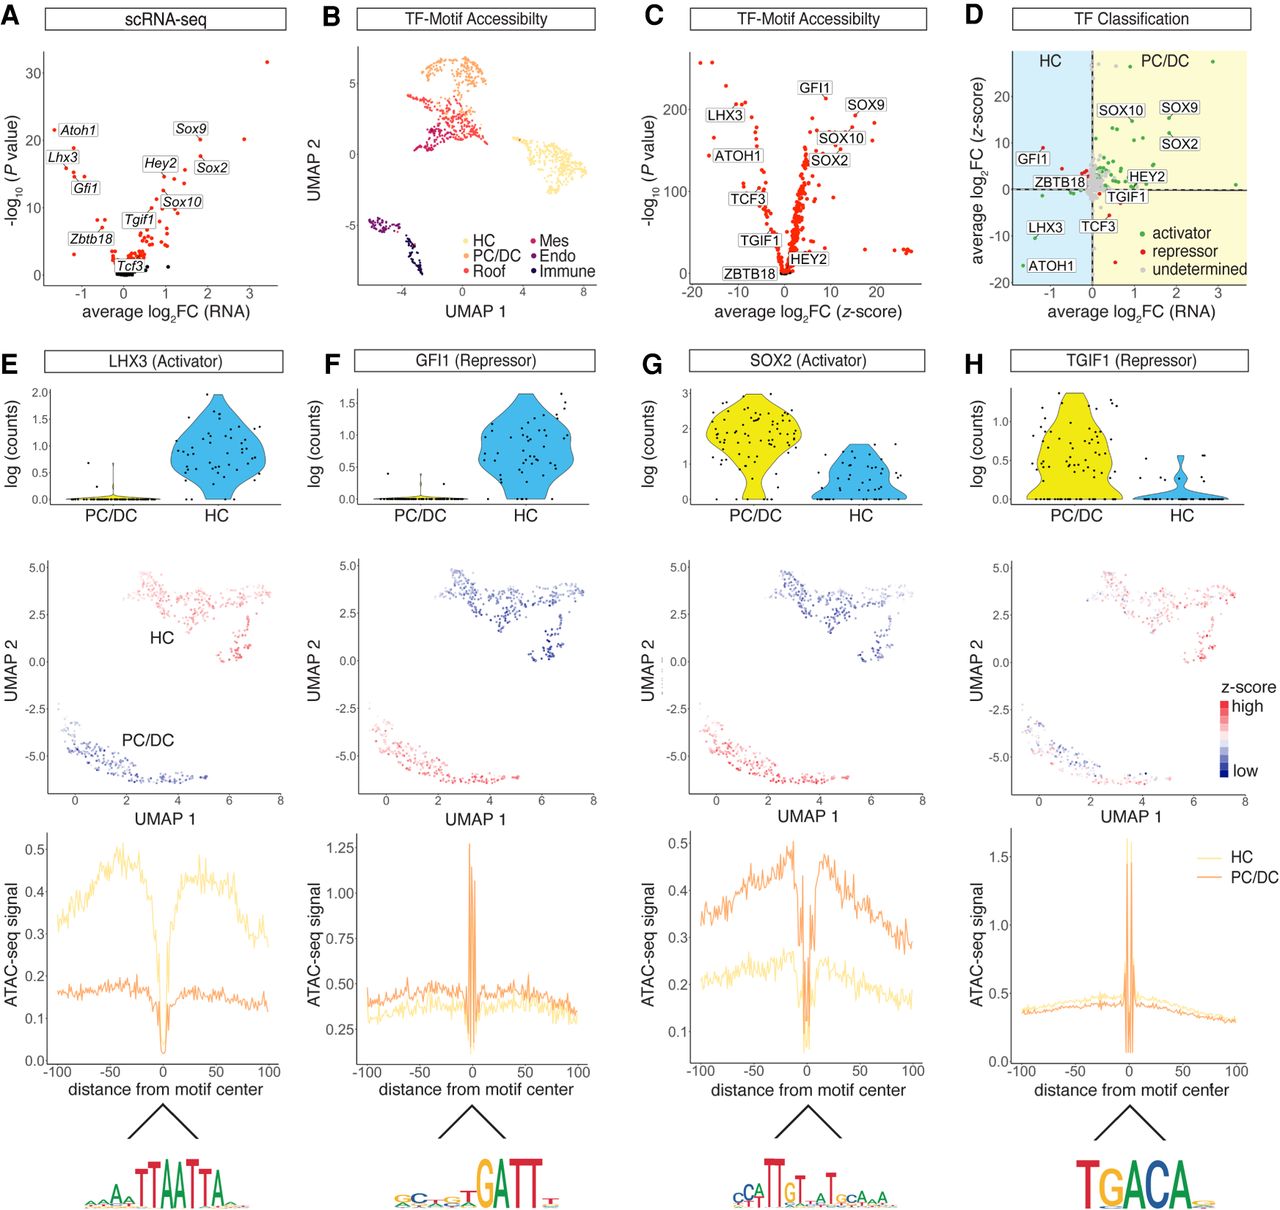
Transcriptional activator and repressor classification. (A) Volcano plot of differentially expressed TF genes between the HC and PC/DC clusters (P-adjusted < 0.05). (B) UMAP of TF motif accessibility z-scores calculated from chromVAR. Cells are color-coded based on SnapATAC clusters. (C) Volcano plot of differential TF motif accessibilities calculated from z-scores between the HC and PC/DC clusters (P-adjusted < 0.05). (D) Dot plot of TF classification shown in average log2 fold change (FC) mRNA level and z-scores. The differential expression from scRNA-seq between HCs and PC/DCs is plotted on the x-axis, and the differential accessibility from scATAC-seq is shown on the y-axis. Activators are classified in green, repressors in red, and undetermined TFs in gray. (E–H) TF activities in differentiating HCs and PC/DCs in terms of mRNA expression, chromatin accessibility, and footprints. (E) LHX3, a transcriptional activator in HCs. (First row) Violin plot of RNA expression. Each dot represents a single cell. (Second row) UMAP plot of LHX3 motif accessibility calculated as z-score. Red indicates higher accessibility compared with blue. Each dot represents a single cell. (Third row) LHX3 footprint calculated from scATAC-seq data using HINT-ATAC. Activators are characterized by high scATAC-seq signal in the flanking region of the TF binding sites compared with the control population. Yellow line represents the HC cluster, and orange line represents the PC/DC cluster. (Fourth row) Mouse HOCOMOCO v10 consensus sequence for the LHX3 motif. (F–H) Analogous data representation for (F) GFI1, classified as a HC repressor; (G) SOX2, a PC/DC activator; and (H) TGIF1, a repressor in PC/DCs.


