
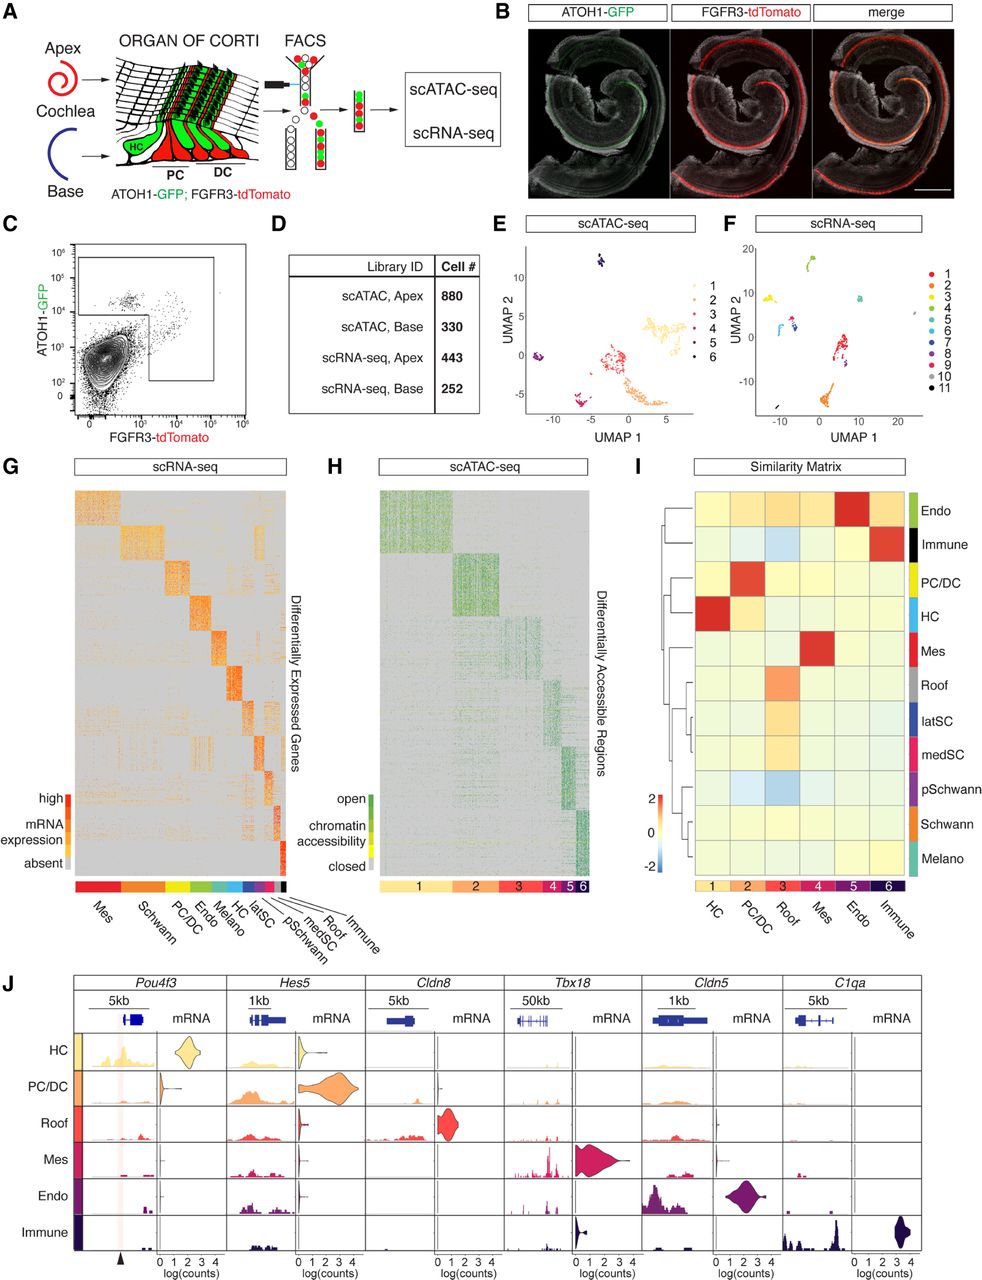
scATAC-seq and scRNA-seq profiling of isolated HCs and PC/DCs. (A) Schematic representation of the experimental workflow used in this study. (B) Representative fluorescent reporter gene expression of ATOH1-GFP and FGFR3-tdTomato in whole-mount preparations of the organ of Corti at P2. Scale bar, 200 µm. (C) FACS plot and gating strategy to isolate cells expressing GFP and tdTomato. (D) Table summarizing sequencing libraries generated and total number of cells per library after quality control. (E,F) UMAP plots to show the clustering of all organ of Corti cells processed in two aggregated libraries to rule out technical variations for scATAC-seq (E) and scRNA-seq (F) experiments. (G) Expression heat map for 695 organ of Corti scRNA-seq cells (x-axis) and DEGs (y-axis). Shown are the top 100 DEGs for each of the 11 clusters identified. Cluster identities were determined based on DEGs known as canonical markers (also see Supplemental Fig. S2A) and indicated with a color bar at the bottom of the heat map. (H) Accessibility heat map for 1210 scATAC-seq cells. The top 100 DARs for each of the six clusters identified are shown, and cluster IDs are indicated with a color bar at the bottom of the heat map. (I) A Jaccard index similarity matrix reveals relations between scATAC-seq clusters and scRNA-seq clusters based on the overlaps between DEGs and annotated DARs. scATAC-seq cluster annotations were determined by the similarity to scRNA-seq clusters (color-coded as in E and F). (J) Enrichment of chromatin accessibility and expression level of candidate genes corresponding to their clusters. Accumulated scATAC-seq fragments at the individual gene locus (left column) and normalized gene expression levels in violin plots (right column) for the six scATAC-seq clusters. Arrowhead at the bottom of the plot indicates a position of a previously published organ of Corti–specific regulatory element (Wilkerson et al. 2019).


