
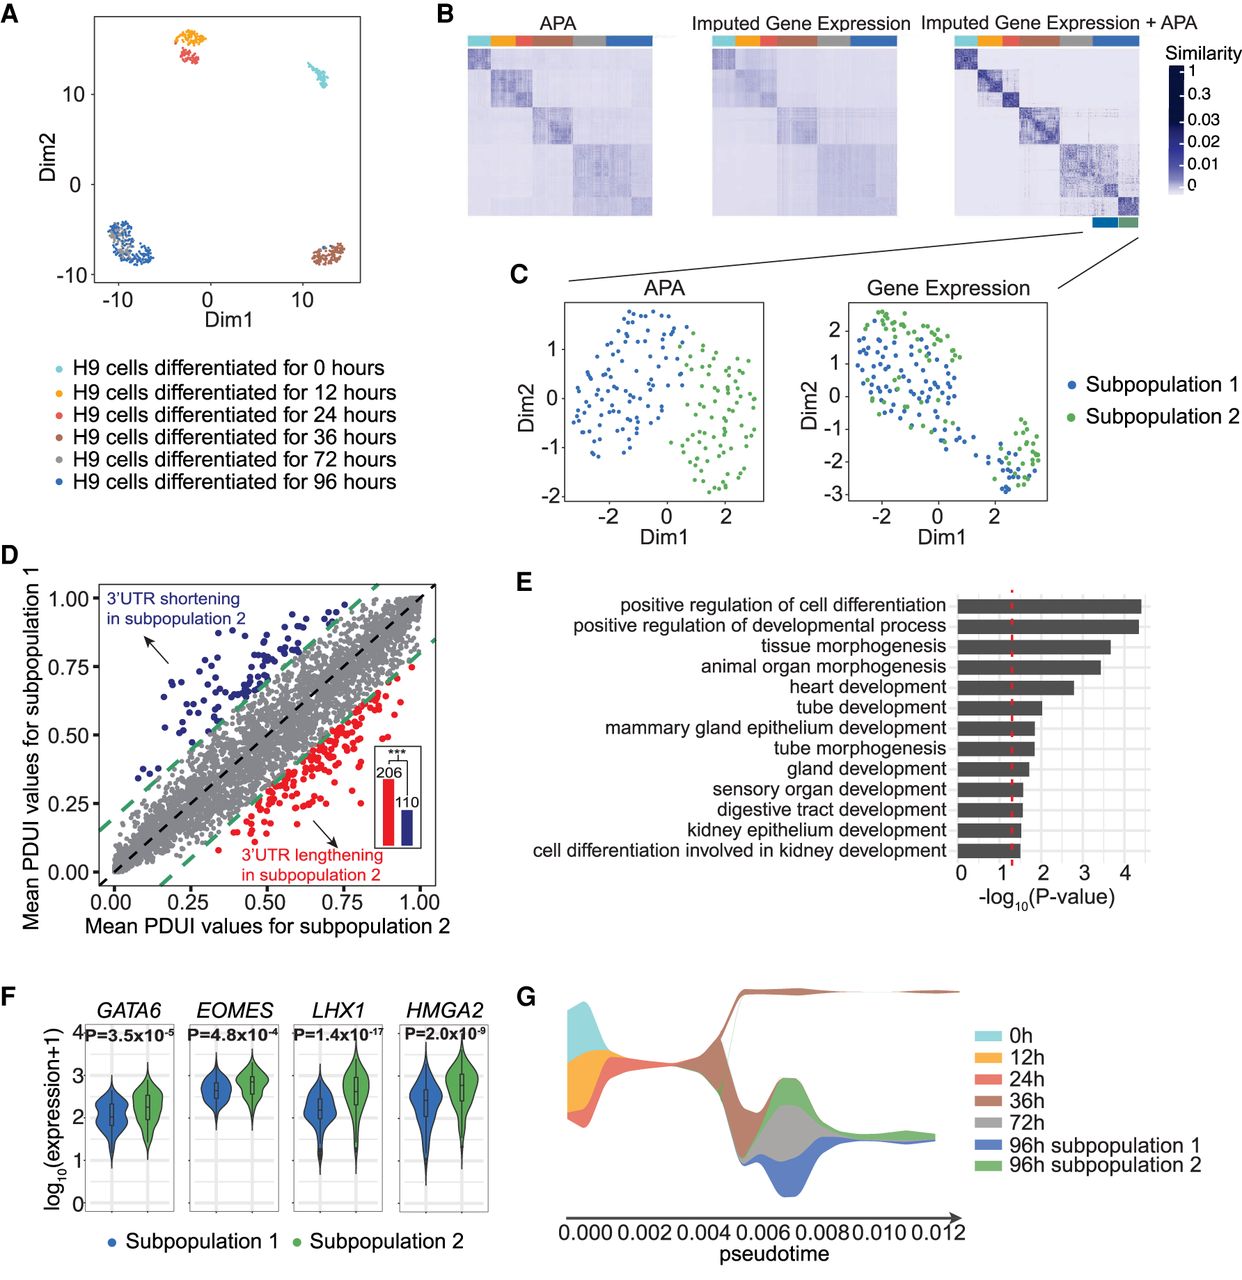
scDaPars helps identify novel cell subpopulations during human embryonic development. (A) Scatter plot shows UMAP results of single cells based on scDaPars-recovered APA profiles. Cells are labeled based on cell differentiation time points given in the original publication. (B) Cell-by-cell similarities represented by similarity matrices generated by R package SNFtool. (C) Scatter plots of UMAP results of cells in 96 h of differentiation based on scDaPars results (left) and imputed gene expression (right). Cells are labeled by results from B. (D) Scatter plot shows mean PDUI values of genes in subpopulation 2 (x-axis) and subpopulation 1 (y-axis). Genes with 3′ UTR shortening and lengthening (FDR ≤ 0.05 and PDUI differences≥0.2) in subpopulation 2 are labeled in blue and red, respectively. Bar plot shows the number of genes with shortening or lengthening in subpopulation 2, and P-value is calculated using single-tailed binomial test. (E) Selected GO terms enriched in the up-regulated genes in subpopulation 2. (F) Example gene expression levels in two subpopulations. (G) Stream plot from STREAM that shows cell density along different trajectories at a given pseudotime.


