
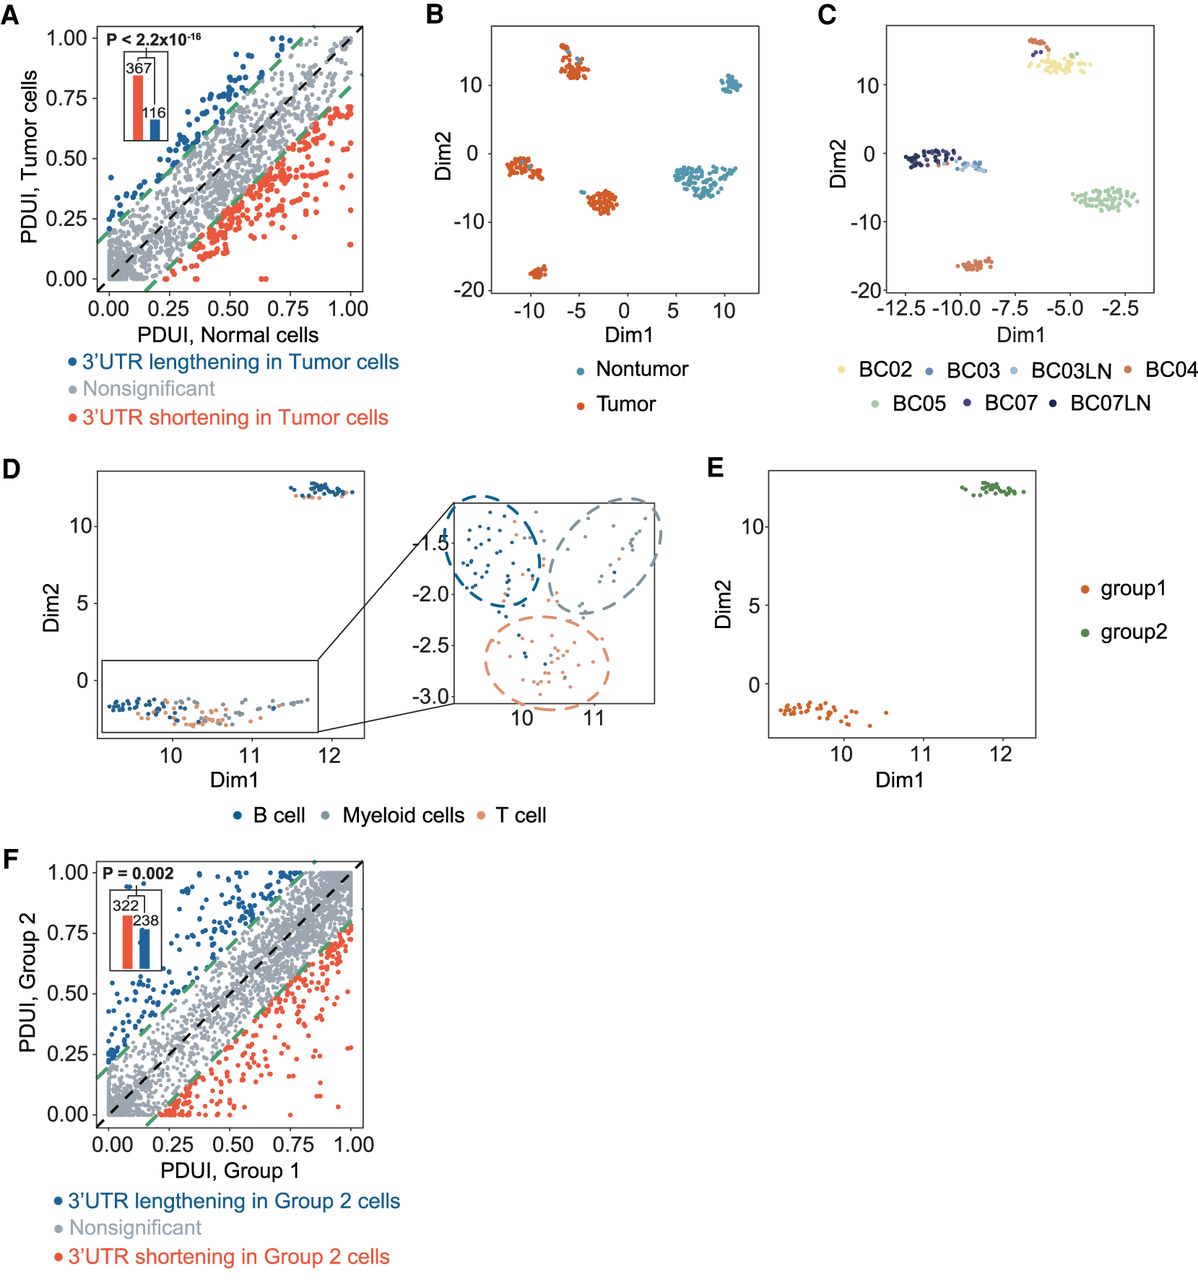
scDaPars reveals tumor-specific and immune-cell-type-specific APA landscape in primary breast cancer. (A) Scatter plot of PDUI values in tumor and normal cells. For each gene, the mean PDUI values in tumor cells (y-axis) are plotted against that in normal cells (x-axis). Genes with shortened or lengthened 3′ UTR (FDR ≤ 0.05 and PDUI difference ≥0.2) in tumor cells are shown in red and blue. Bar plot shows the number of shortening genes or lengthening genes in tumor cells, and P-value is calculated using a single-tailed binomial test. (B) Scatter plot gives UMAP results calculated from scDaPars-restored APA profiles. Each dot represents a cell, and cells are labeled based on cell index provided in the original publication. (C) Scatter plot of UMAP results of tumor cells. Cells are labeled by patient information. (D) Scatter plot of UMAP results of immune cells. Cells are labeled by cell type information. (E) Scatter plot of UMAP results of B cells based on scDaPars results. (F) Scatter plot of PDUI values in group 1 B cells and group 2 B cells. For each gene, the mean PDUI values in group 2 B cells (y-axis) are plotted against that in group 1 B cells (x-axis). Genes with shortened or lengthened 3′ UTR (FDR ≤ 0.05 and PDUI difference ≥0.2) in group 2 B cells are shown in red and blue. Bar plot shows the number of shortening genes or lengthening genes in group 2 cells.


