
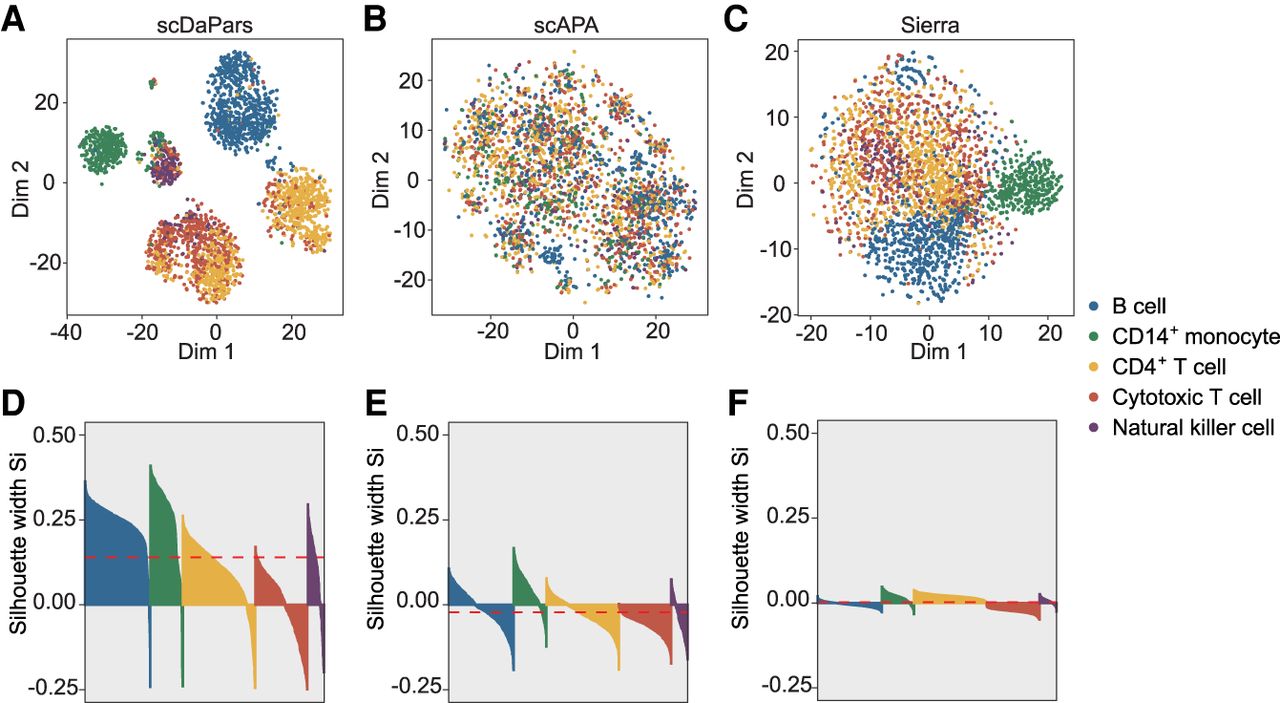
scDaPars outperforms existing methods by quantifying APA usage at single-cell resolution. (A–C) Scatter plots showing UMAP results of 3362 PBMCs based on scDaPars quantified APA usage (A), scAPA quantified APA usage (B) or Sierra quantified APA usage (C). (D–F) Silhouette plots for clustering results from scDaPars (D), scAPA (E), and Sierra (F). The x-axis represents cells, and y-axis is the corresponding silhouette coefficient Si for each cell. The silhouette coefficient measures how similar a cell is to its own cluster compared with other clusters; therefore, a higher silhouette coefficient indicates a better clustering result, and a negative coefficient may suggest the cell is assigned to the wrong cluster. The red dashed line is the average Si for all cells.


