
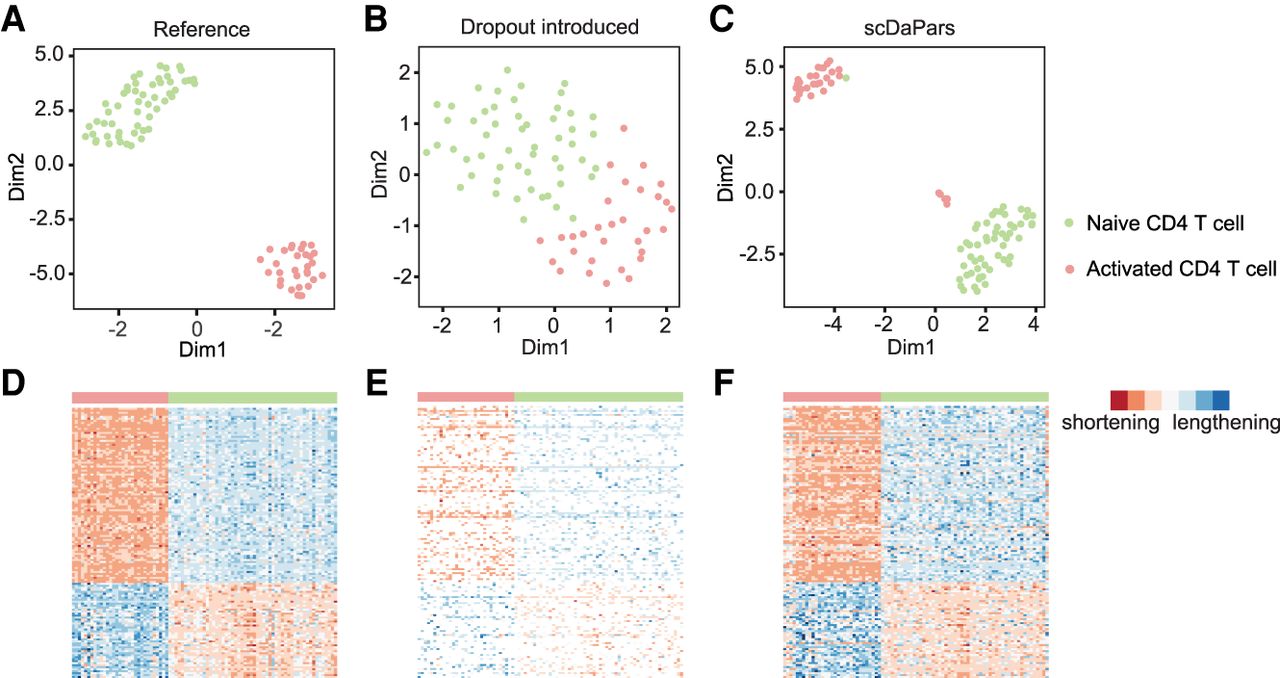
Evaluation of scDaPars in identifying dynamic APA events between two cell types using naive and activated CD4 T cells. (A–C) Scatter plots showing UMAP results of 54 naive CD4 T cells and 31 activated CD4 T cells based on reference APA profiles (A), dropout events introduced APA profiles (B), or scDaPars corrected APA profiles (C). (D–F) Heat maps showing APA profiles of 136 differential APA genes (FDR ≤ 0.05 and PDUI differences ≥0.2) in the reference data (D), dropout events introduced data (E), and scDaPars corrected data (F). Rows represent differential APA genes and columns represent cells. Eighty-eight out of 136 differential APA genes have shorter 3′ UTRs in activated CD4 T cells in the reference data.


